In volatile crypto markets, timing matters and momentum often signals that timing. The Relative Strength Index (RSI), developed by J. Welles Wilder, remains one of the most practical tools for analyzing price behavior. Rather than tracking prices alone, RSI measures the pace and persistence of gains and losses, offering a clearer view of short term strength or exhaustion.
Plotted on a scale from 0 to 100, RSI helps identify potential overbought or oversold conditions. Readings above 70 suggest bullish momentum may be stretched; below 30 indicates possible selling exhaustion. These signals can act as early warnings, highlighting when a move may be nearing its limit or primed for a reversal.
For crypto traders, RSI isn’t just about entry signals. It’s a way to read when momentum is building, when it’s fading, and how that relates to current price structure. This article explains how to use RSI in crypto trading with real examples so you can read market shifts with more precision, not just prediction.
What Is the Relative Strength Index(RSI) Indicator?
The Relative Strength Index (RSI) is a momentum indicator used in technical trading systems to measure how quickly and strongly an asset’s price is moving. It helps traders assess whether cryptocurrency is potentially overbought or oversold based on recent price performance.
The RSI indicator operates on a scale from 0 to 100. By default, it uses a 14 period setting, meaning it analyzes the past 14 candles on your selected timeframe (e.g., 14 hours on a 1 hour chart). Here's how it works:
• RSI is calculated by comparing the average gain and average loss over the set period.
• If gains dominate, the RSI moves closer to 100, indicating strong bullish momentum.
• If losses dominate, the RSI drops toward 0, reflecting bearish momentum.
Typical thresholds:
• RSI > 70 = Overbought
• RSI < 30 = Oversold
Unlike lagging indicators like moving averages, RSI is considered a leading indicator that can highlight potential trend shifts before they occur. For crypto traders, it’s a go to tool for spotting exhaustion in both upward and downward price moves.
Key Benefits of RSI for Crypto Traders
• Identify overbought and oversold levels to time crypto market reversals
• Works well in both trending and ranging crypto environments
• Offers early signals before major price movements
• Useful for strategies like divergence spotting, swing rejections, and breakout trades
• Adjustable settings to fit any crypto asset, timeframe, or trading style
• Helps optimize entry timing and manage risk more effectively
• Intuitive and visual, making it great for both new and experienced crypto traders
How to Read RSI on a Price Chart
The Relative Strength Index (RSI) appears below the main price chart on most trading platforms. It’s displayed as a line oscillating between 0 and 100, measuring the momentum behind recent price changes. This makes it easier to evaluate whether the market is overbought or oversold based on current strength.
Here are the key RSI zones:
• Above 70: Indicates that overbought territory, suggesting that momentum may be stretched, and a pullback could follow.
• Below 30: Signals oversold territory, suggesting the asset may be undervalued or near a reversal.
 Source: BTC/USDT Trading Chart on BingX
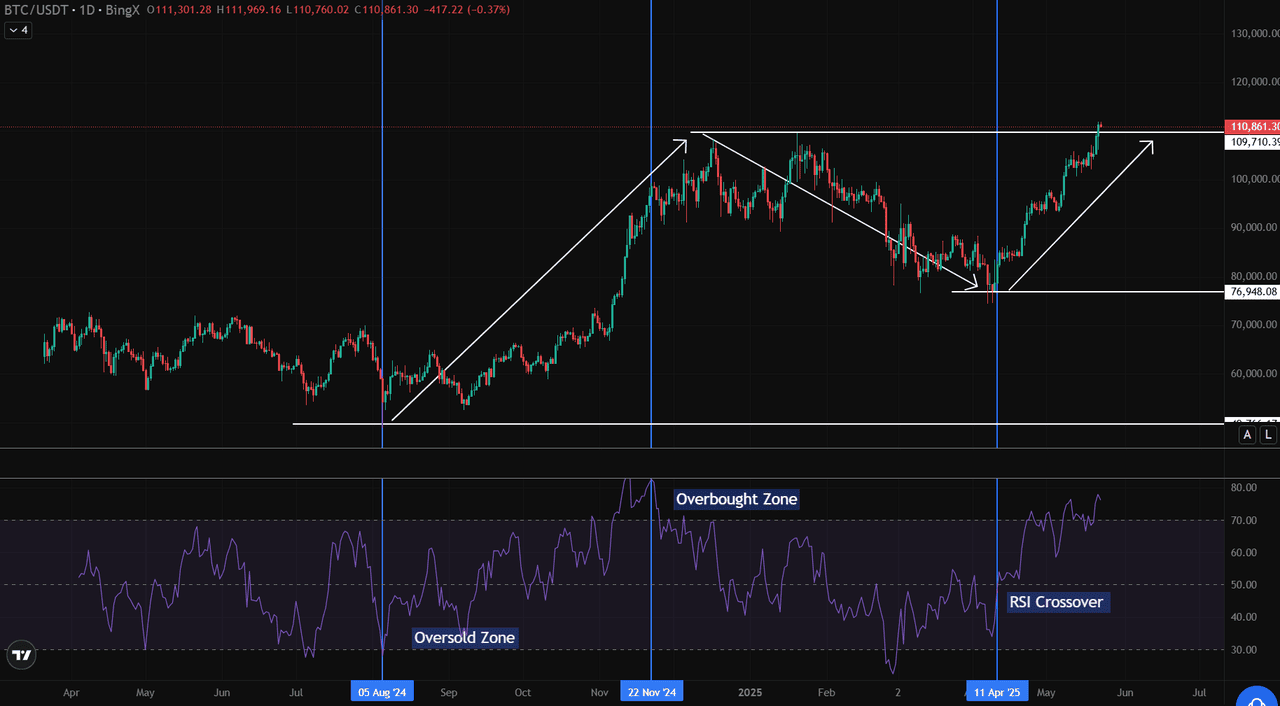
 On the BTC/USDT daily chart from BingX:
• On August 5, 2024, RSI dipped to 28 while Bitcoin traded around $76,950. This oversold level aligned with a price bottom, after which BTC rebounded sharply.
• By November 22, 2024, RSI reached 76, as Bitcoin peaked near $110,000, making it a classic sign of overbought conditions.
• On April 11, 2025, RSI crossed back above 50, and price broke above $100,000, signaling a renewed bullish trend after consolidation.
These moves show how strength index RSI helps interpret market conditions beyond just raw price. When RSI falls or rises alongside price, it adds confidence. When it diverges, it can even signal early trend shifts before they’re visible on the candles.
For crypto traders, this makes RSI a crucial tool for filtering entries, exits, and momentum trades.
Use RSI in Your Crypto Trading Strategies
The Relative Strength Index (RSI) isn’t just for spotting momentum. It’s a flexible tool that fits a variety of crypto trading strategies, especially in fast moving markets. Whether you’re scalping intraday moves or holding positions for days, RSI can help time entries, filter breakouts, and catch early trend shifts.
Which trading styles is RSI suited for?
• Scalpers and intraday traders use lower period RSI (e.g., 7 or 9) on short timeframes like 5 min or 15 min charts to catch quick moves.
• Swing traders rely on standard RSI settings (14 period) on 1H to 4H charts to track mid term reversals.
• Position traders often use daily or weekly RSI to confirm broader trend exhaustion or divergence.
Here are three powerful RSI strategies you can apply in the crypto market:
1. Overbought and Oversold Levels
RSI is most commonly used to spot potential turning points by identifying overbought and oversold conditions:
• Overbought (RSI > 70): Suggests the asset may be overextended after a bullish move.
• Oversold (RSI < 30): Implies the asset may be undervalued or due for a rebound.
 Source: BTC/USDT Trading Chart on BingX
 On August 7, 2024, RSI dropped below 30, while BTC traded around $47,940. It's a clear oversold level that preceded a strong trend reversal.
 Source: BTC/USDT Trading Chart on BingX
 By November 22, 2024, RSI hit 76 and BTC peaked near $110,000, marking an overbought zone before price began to fall.
These levels become more reliable when aligned with broader trend context or support/resistance.
2. RSI Divergence Trading
Divergence occurs when RSI and price action move in opposite directions. It's a signal of weakening momentum and a possible trend reversal.
• Bullish Divergence: Price makes lower lows, RSI makes higher lows.
• Bearish Divergence: Price makes higher highs, RSI makes lower highs.
Use divergence alongside price structure (like double bottoms or tops) for better accuracy.
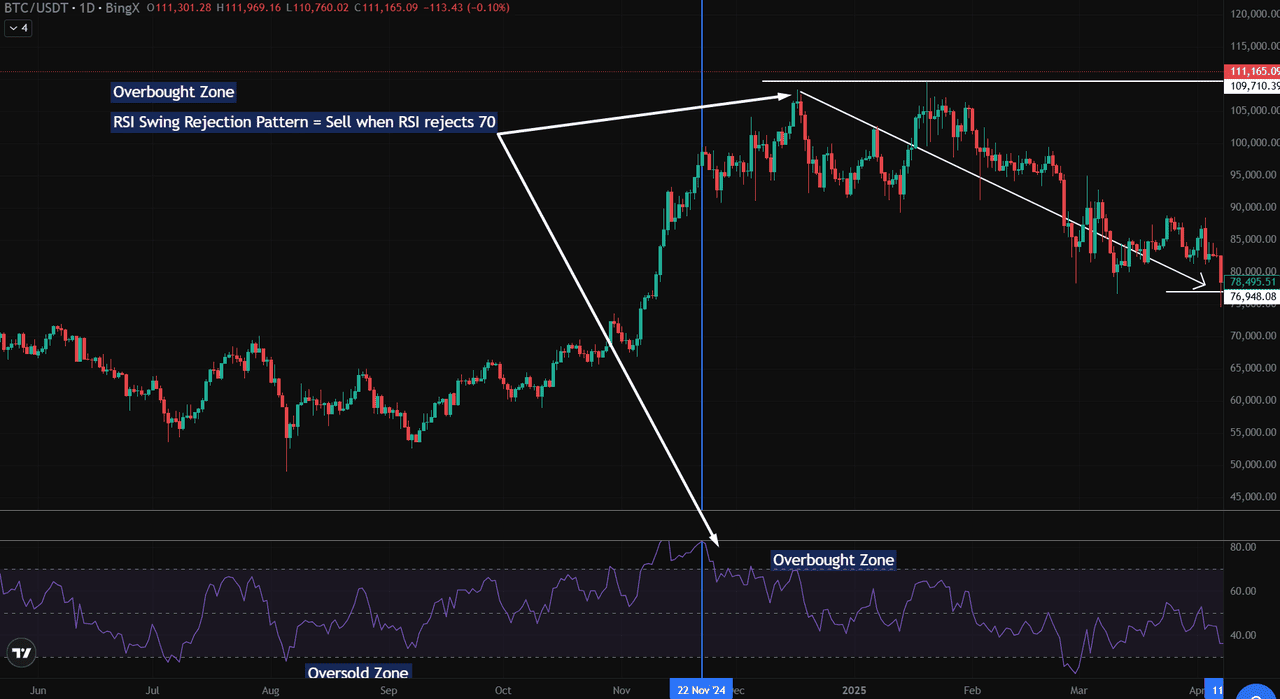
3. RSI Swing Rejection Pattern
This aggressive strategy focuses on how RSI reacts at 30 or 70, rather than just crossing those levels.
Bullish Setup: RSI dips below 30, then rebounds back above it.
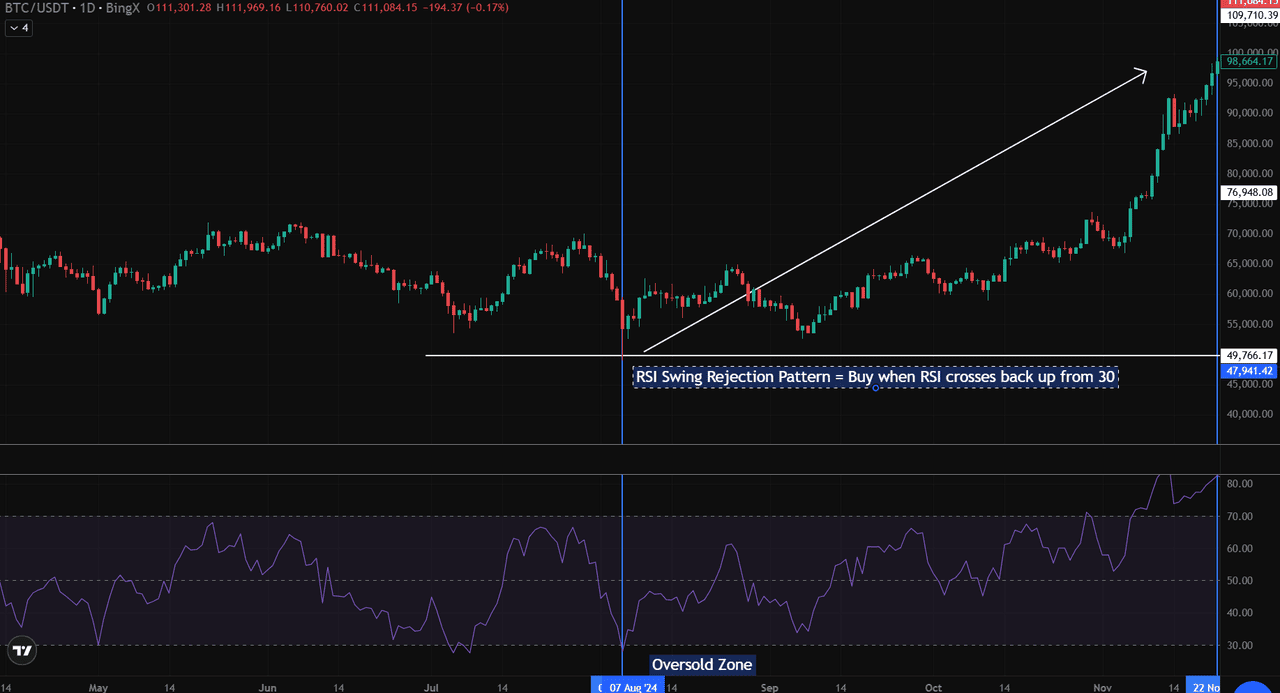 Source: BTC/USDT Trading Chart on BingX
 For Example: On August 7, 2024, RSI rejected the oversold zone and climbed from 28 to 40. BTC rose from $47,940 to $98,664 in the weeks following.
Bearish Setup: RSI enters above 70, fails to hold, and drops back below.
For Example: On November 22, 2024, RSI rejected 70. BTC fell from around $110,000 to $78,500 within weeks.
 Source: BTC/USDT Trading Chart on BingX
 These RSI breaks of key zones provide high probability buy and sell signals, especially when combined with support/resistance and volume analysis.
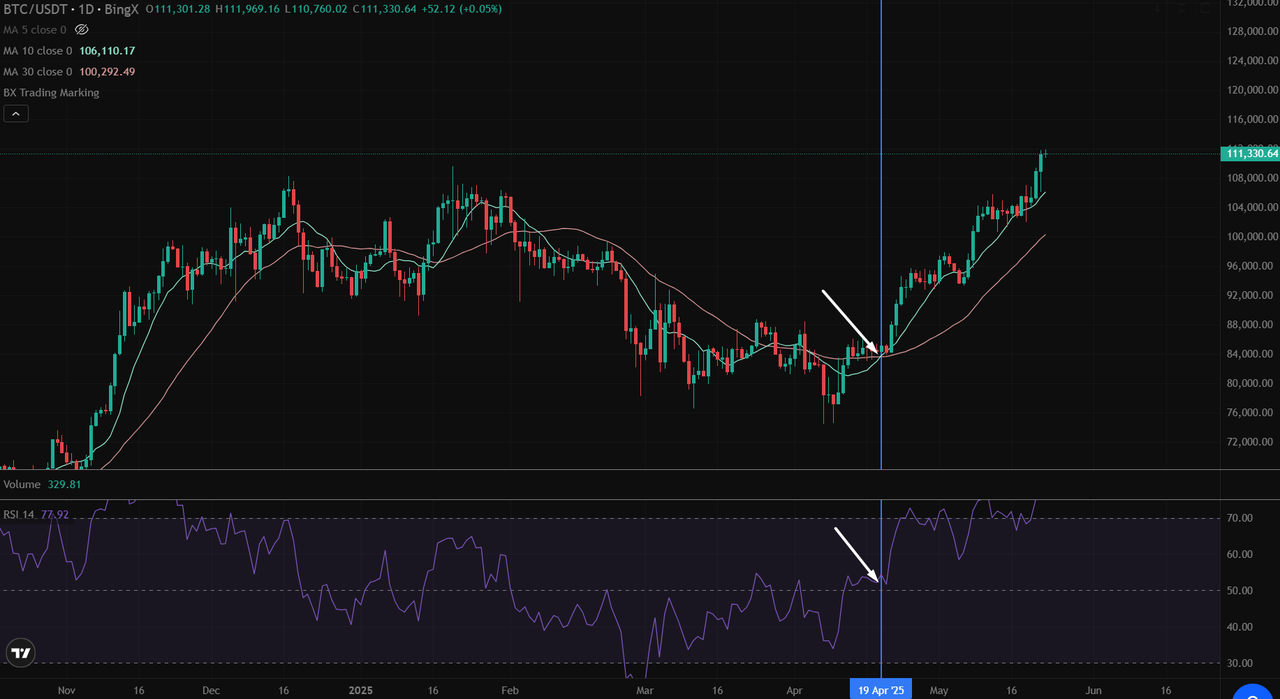
Bonus Tip: RSI + Moving Average Crossovers
Another powerful strategy is to combine RSI with moving average crossovers to confirm momentum shifts.
In the BTC/USDT chart above, RSI crossed above 50 on April 19, 2025, while the 10 day moving average crossed above the 30 day moving average, a classic bullish signal. This combination confirmed that momentum was building and that price was likely to continue higher, which it did.
How to use it:
• Wait for RSI to move above 50, signaling bullish momentum
• Then confirm with a short term MA (e.g., 10 day) crossing above a longer term MA (e.g., 30 day)
• Use price structure or trend lines to define your entry and exit points
This setup helps filter out false RSI signals and works well for trend following strategies in both swing and position trading.
 Source: BTC/USDT Trading Chart on BingX
 Pro Tip: Whatever strategy you choose, always test it on historical data and demo trades. RSI is powerful, but context matters. You should pair it with a strong price structure, volume, and overall market trend for the best results.
RSI Settings and Timeframe Tweaks
The Relative Strength Index (RSI) typically uses a 14 period setting, which balances sensitivity with reliability. But depending on your trading style, adjusting the RSI settings can provide sharper signals or filter out market noise.
Best RSI Settings by Strategy:
• RSI 7 (Short Term): Ideal for scalping or high frequency trades on 1 min to 15 min charts. It reacts quickly but may generate more false signals in choppy conditions.
• RSI 14 (Default): A good all rounder for swing trading and general technical analysis, often used on 1H, 4H, or daily charts.
• RSI 21 (Long Term): Suitable for position trading or automated strategies that focus on broader index RSI trends with fewer whipsaws.
In trading bots, slower RSI values (e.g., 21–30) are often paired with other indicators like moving averages to filter trades more conservatively. Shorter RSI settings are used for aggressive strategies that target volatility spikes.
The key is to align your RSI configuration with your market timeframe and goals. Regardless of your preference, RSI remains one of the most adaptive tools in any technical analysis framework.
Combining the Use of RSI with Other Technical Indicators
While the Relative Strength Index (RSI) can highlight momentum shifts, combining it with other technical indicators helps confirm signals and avoid false alarms, especially in fast moving crypto markets.
The most effective RSI combos often include:
• MACD (Moving Average Convergence Divergence) for trend acceleration
• Moving Averages (e.g., 200 day MA) to define long term trend bias
• Trend Lines to frame breakouts and support/resistance zones
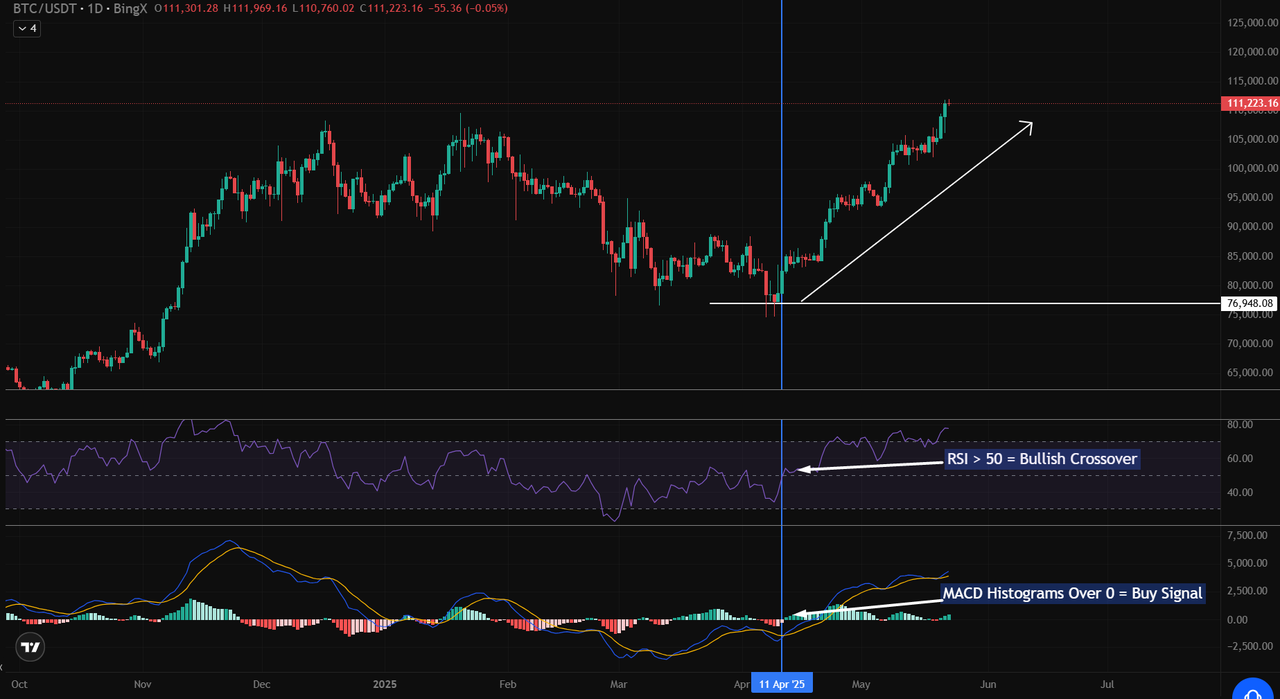 Source: BTC/USDT Trading Chart on BingX
 Example: BTC/USDT Daily Chart on BingX
For example, on April 11, 2025, multiple indicators aligned for a high confidence buy setup:
• RSI crossed above 50, confirming renewed bullish momentum
• MACD histogram flipped positive, signaling a bullish crossover
• Price broke above a key horizontal resistance near $77,000, and continued rallying above $100,000
• Trendline support held around $76,950, reinforcing structure
This combination provided a textbook trend continuation confirmation. Traders who waited for this multi signal alignment could have entered around $80,000 with a more confident setup, reducing the risk of reacting to short term noise.
Combining RSI with tools like MACD and moving averages ensures traders aren’t relying on a single input. It strengthens your ability to spot real momentum shifts in line with broader market structure and increases the probability of catching sustainable trends.
RSI Limitations in a Trending Market
The RSI indicator is a reliable tool, but it’s not foolproof, especially during strong trends. It can produce misleading signals if not viewed in the right context.
Here’s why:
• In a bullish trend, RSI may enter overbought territory (>70) early while the price keeps climbing.
• In a bearish trend, RSI can stay oversold (<30) for long stretches even as the price continues falling.
What’s the issue?
• RSI only measures recent momentum, not the broader trend structure.
• Without that context, traders may:
- Exit winning trades too soon
- Enter counter trend setups based on early signals
How to avoid misreading RSI:
• Combine RSI with other tools like:
- Moving Averages (trend direction)
- Higher timeframe confirmation (structural support/resistance)
• Treat RSI as part of a complete trading strategy, not a standalone signal.
Conclusion
The Relative Strength Index (RSI) remains one of the most widely used and effective momentum indicators in cryptocurrency trading and for good reason. It offers traders a clear view of momentum shifts, helps spot early buy or sell signals, and often highlights potential reversals before they’re visible in price action alone.
To get the most out of RSI, it’s important to adapt it to your trading style. Try testing different settings such as 7, 14, or 21 periods depending on your chosen timeframe. Shorter periods make RSI more responsive for scalping, while longer settings smooth out noise for swing or position trading.
For better reliability, combine RSI with other tools. Trend lines add structure, helping define where RSI signals align with market patterns. MACD can confirm momentum shifts through crossovers, and moving averages provide a broader view of directional bias. Always validate RSI signals using real price action and market context, not in isolation.
Ready to put it into practice? Head over to BingX price charts, apply RSI to your favorite crypto pairs, and start testing your strategy whether manually or through automated bots.
Frequently Asked Questions (FAQ)
1. What is the best RSI setting for crypto?
The default setting of 14 periods works well for most traders. However, short term traders may prefer RSI 7 for faster signals, while long term investors might opt for RSI 21 to reduce false triggers. It depends on your trading style and timeframe.
2. Can RSI be used for scalping or day trading?
Yes. RSI is effective for scalping on lower timeframes like 1 minute or 5 minute charts, especially when combined with support/resistance or volume. For day trading, use RSI on 15 min to 1 hour charts and confirm setups with other tools to avoid false signals.
3. Does RSI work better with Bitcoin or altcoins?
RSI works on both, but it tends to be more reliable on high volume assets like Bitcoin and Ethereum. Low liquidity altcoins can produce erratic RSI behavior due to sudden spikes or thin order books.
4. How does RSI compare to MACD in crypto markets?
RSI measures momentum strength and extremes (overbought/oversold), while MACD focuses on trend confirmation and crossover momentum. Both are useful, but RSI reacts faster, while MACD is better for spotting sustained directional moves.
5. Is RSI reliable for sideways markets?
Yes, the Relative Strength Index (RSI) works well in range bound markets by highlighting overbought and oversold zones between support and resistance. It’s a useful tool for spotting potential reversals within a sideways trend.
However, RSI is best used alongside trend lines, support/resistance, or volume to avoid false signals and improve accuracy in low volatility environments.