When crypto prices rise unexpectedly, heavily leveraged traders holding short positions are pushed toward their liquidation price. As losses grow, exchanges automatically close those positions by buying back the asset. That forced buying adds immediate upward pressure, often triggering more liquidations in the same direction.
What follows is a feedback loop. Each liquidation pushes price higher, which forces more traders to exit, accelerating the move without requiring fresh optimism or capital.
This dynamic has played out repeatedly in recent Bitcoin rallies, where modest catalysts quickly escalated into market-wide liquidations across major tokens. In highly leveraged crypto markets, price doesn’t move gradually. When leverage builds, markets don’t drift. They snap.
What Is a Short Squeeze in the Crypto Market?
In crypto markets, a short squeeze occurs when traders betting on lower prices are pushed out as the market moves against them. Because most short trades use leverage, even a modest price increase can turn into a rapid surge within minutes.
Short positions work by borrowing Bitcoin, selling it at the current price, and planning to buy it back later at a lower level. If BTCUSDT falls, the trader profits. But when price rises instead, losses grow quickly. To keep the position open, traders must maintain margin. Once losses cross a certain threshold, the exchange automatically closes the trade.
That closure creates forced buying. To exit a short position, Bitcoin must be bought back at the market price. When many short positions are clustered near the same level, a single push higher can trigger multiple buy orders at once, driving price even higher and liquidating additional shorts.
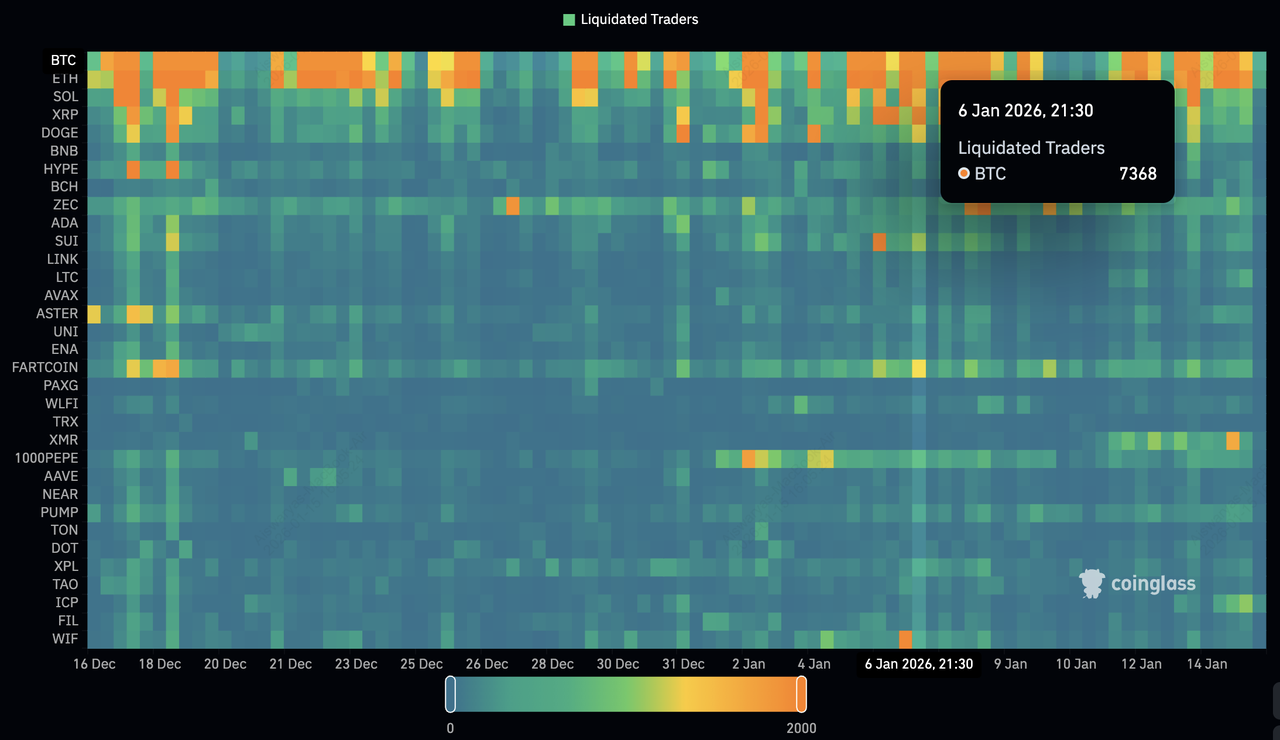
Crypto liquidation history heatmap | Source: CoinGlass
On January 6, 2026, cryptocurrency markets experienced a major short squeeze, with around $415 million in forced liquidations over 24 hours. About 77% of these came from short positions as Bitcoin’s price surged toward $94,000, according to CoinGlass.
In volatile crypto markets, short squeezes explain why prices can rise far faster than fundamentals alone would suggest.
How Liquidations Turn Small Moves Into Chain Reactions
Liquidations occur when a leveraged trade reaches its liquidation price, the point where a trader no longer has enough margin to keep the position open. Before that, an exchange may issue a margin call asking for more collateral. In fast-moving crypto markets, prices often move too quickly, and positions are closed automatically.
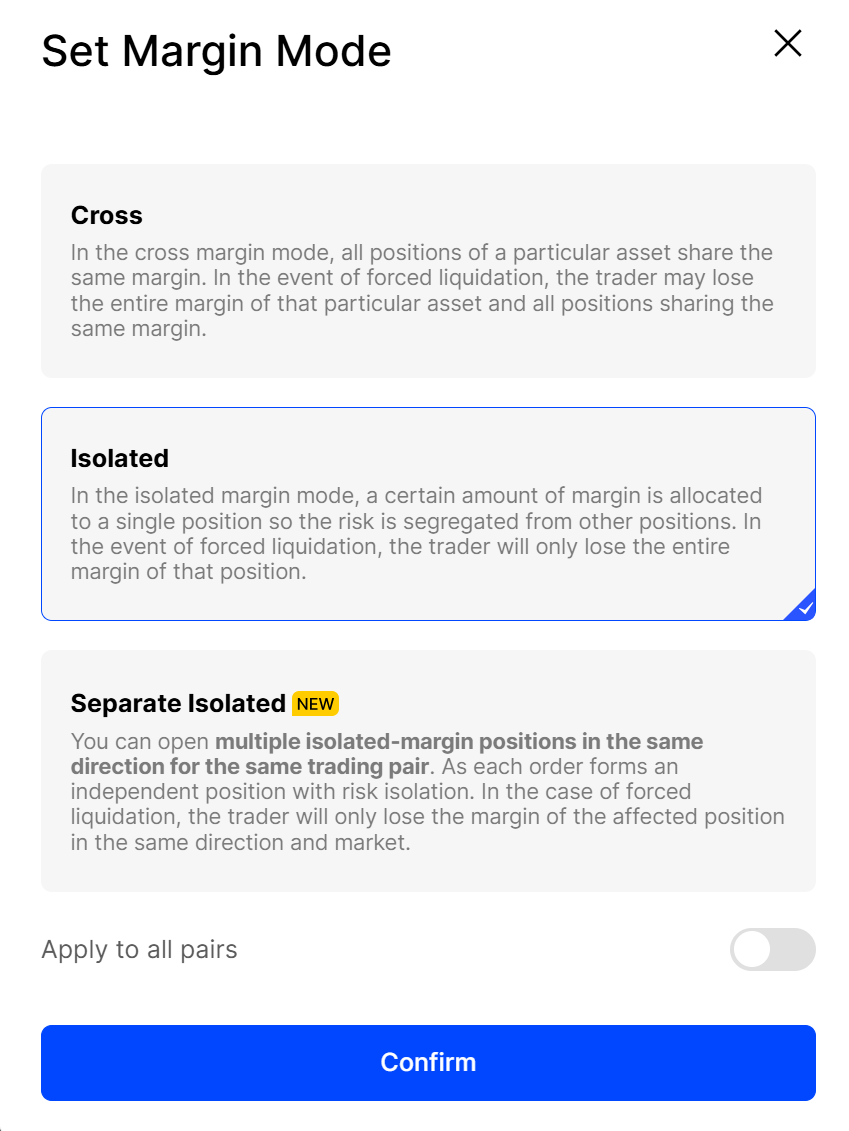
The impact depends on the margin type.
• With isolated margin, losses are limited to a single position.
• With cross margin, the trader’s entire account balance backs the trade, increasing the risk of deeper losses during sharp moves.
Once price breaches key liquidation levels, exchanges execute forced liquidations at market prices. These forced trades add pressure in the same direction as the move. Short liquidations create aggressive buying, while long liquidations trigger rapid selling. Instead of stabilizing price, liquidations often intensify it.
For example: If Bitcoin is trading near $100,000 and a push toward $102,000 hits a cluster of short liquidations, forced buying can quickly lift price toward $105,000. Each liquidation pushes price higher, triggering more liquidations above.
This creates a feedback loop. One forced exit leads to another, forming a chain reaction that explains why crypto prices can spike or crash far faster than expected in leveraged markets.
Why High Leverage Makes Crypto Moves Explode
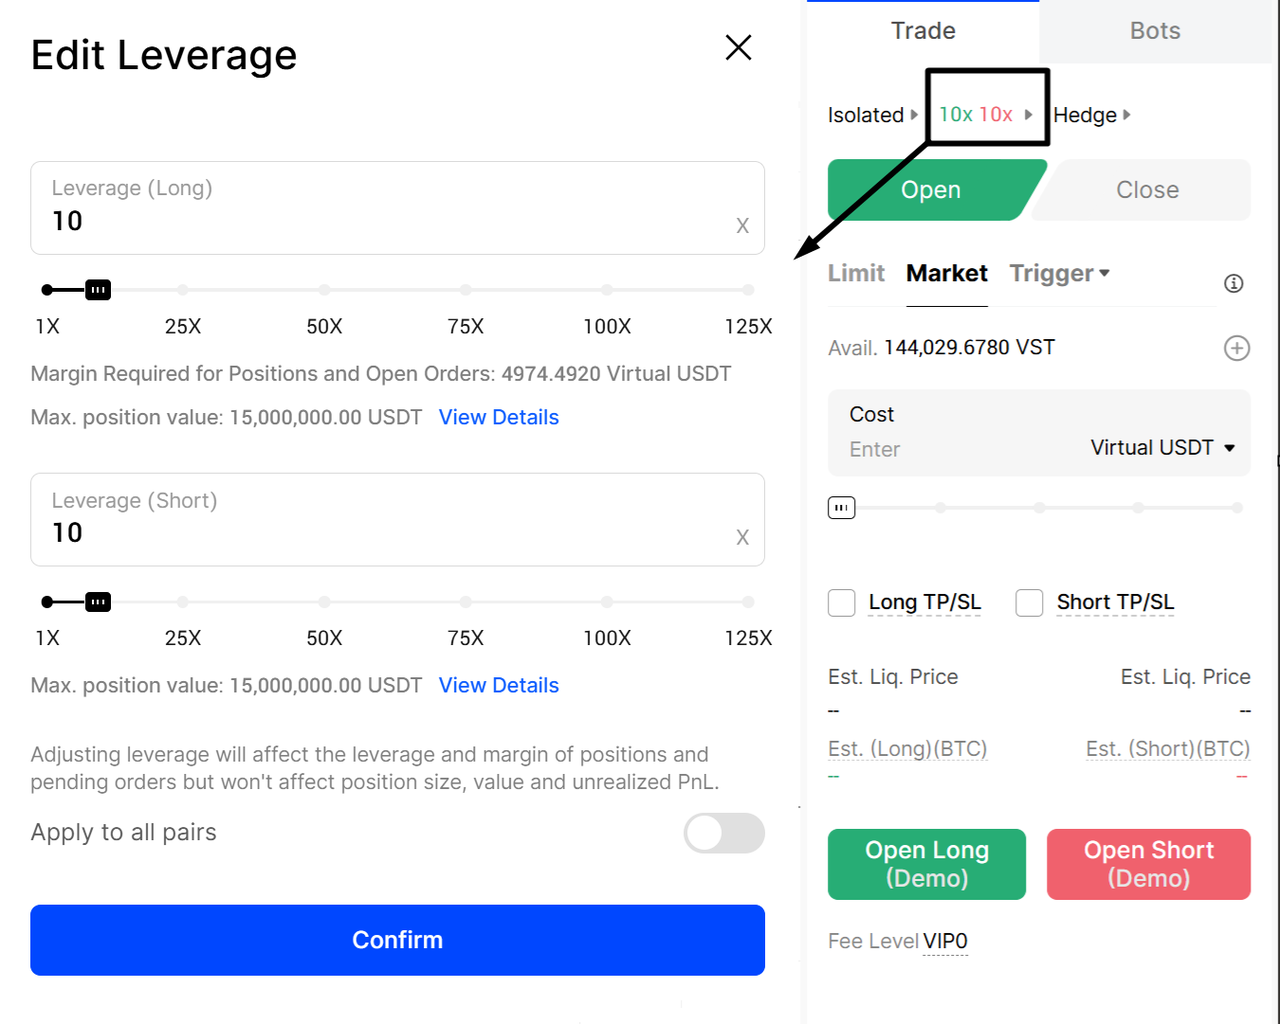
Leverage is the fuel behind crypto’s fastest moves. It allows traders to control large positions with relatively small capital, which is why derivatives markets dominate crypto trading activity. But this efficiency comes with a trade-off: even minor price changes can trigger outsized reactions.
In crypto, a 1–2% move is normal daily volatility. For traders using 50x or 100x leverage, that’s enough to trigger liquidation. When that happens, exchanges automatically close positions at market prices. Those forced exits hit the order book as aggressive buys or sells, pushing price further in the same direction.
The risk intensifies when traders crowd into one side of the market. If many shorts or longs sit near similar levels, a routine price move can trigger a wave of liquidations. What starts as a small breakout or pullback quickly turns into a surge or a dump.
Crypto reacts faster than traditional markets because it trades 24/7, globally, with no circuit breakers. With leverage layered on top, price doesn’t adjust gradually. It snaps.
Bitcoin, Inflation Data, and Market News as Triggers
Macro news often provides the spark, but positioning determines how explosive the move becomes. A clear example was the US CPI release on January 13, 2026, covering December inflation data. Headline CPI held steady at 2.7% year over year, while core CPI eased to around 2.6%. While the print was largely in line, it reduced fears of renewed inflation pressure and lowered the perceived risk of aggressive Federal Reserve tightening. Markets quickly shifted toward a risk-on stance.
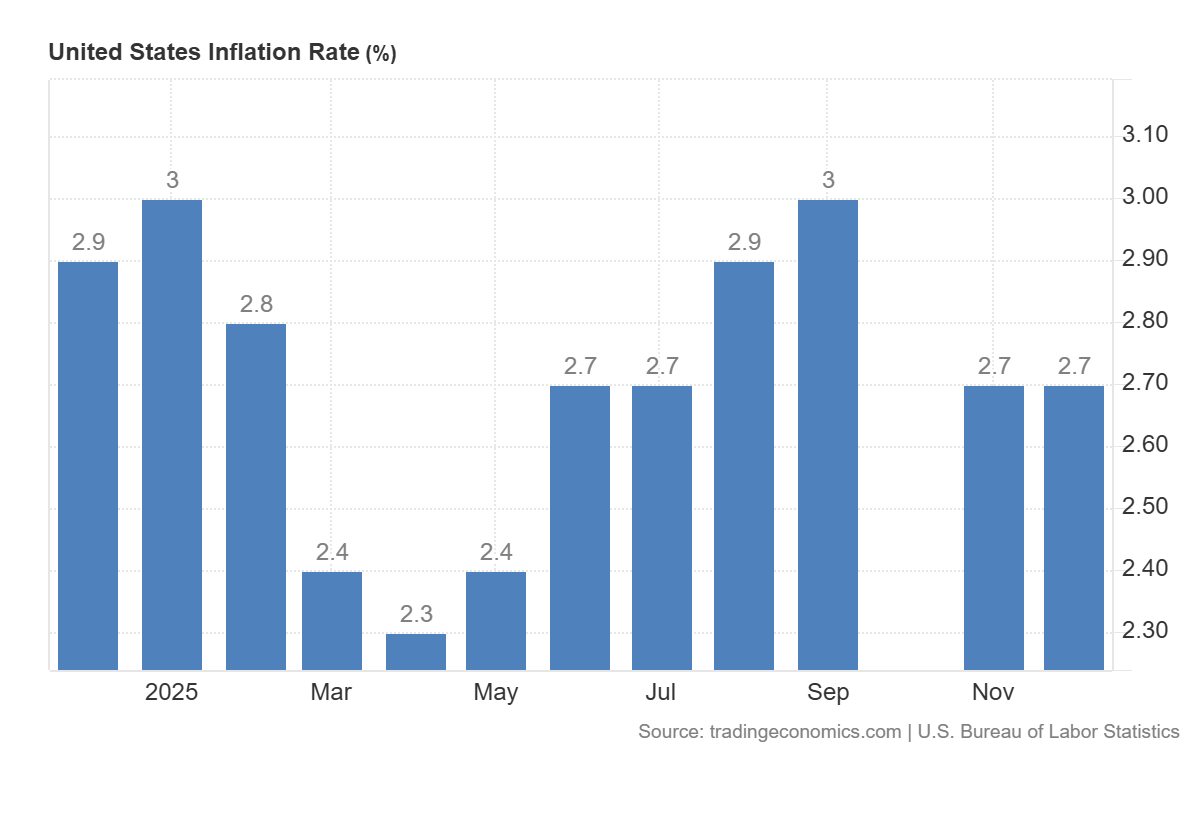
United States Inflation Rate via U.S. Bureau of Labor Statistics - Source: Tradingeconomics
The Bitcoin price reacted first. BTC broke out from a consolidation range near $92,000–$93,000 and surged toward $96,000–$98,000, marking its strongest move in weeks. But the speed of the rally was not driven by spot demand alone. It was driven by derivatives positioning.
Ahead of the release, Bitcoin open interest remained elevated near $66–$67 bn, showing traders were still holding large leveraged positions.
At the same time, funding rates drifted toward zero and briefly turned negative, meaning short traders were paying to maintain exposure. That combination signaled crowded bearish positioning.
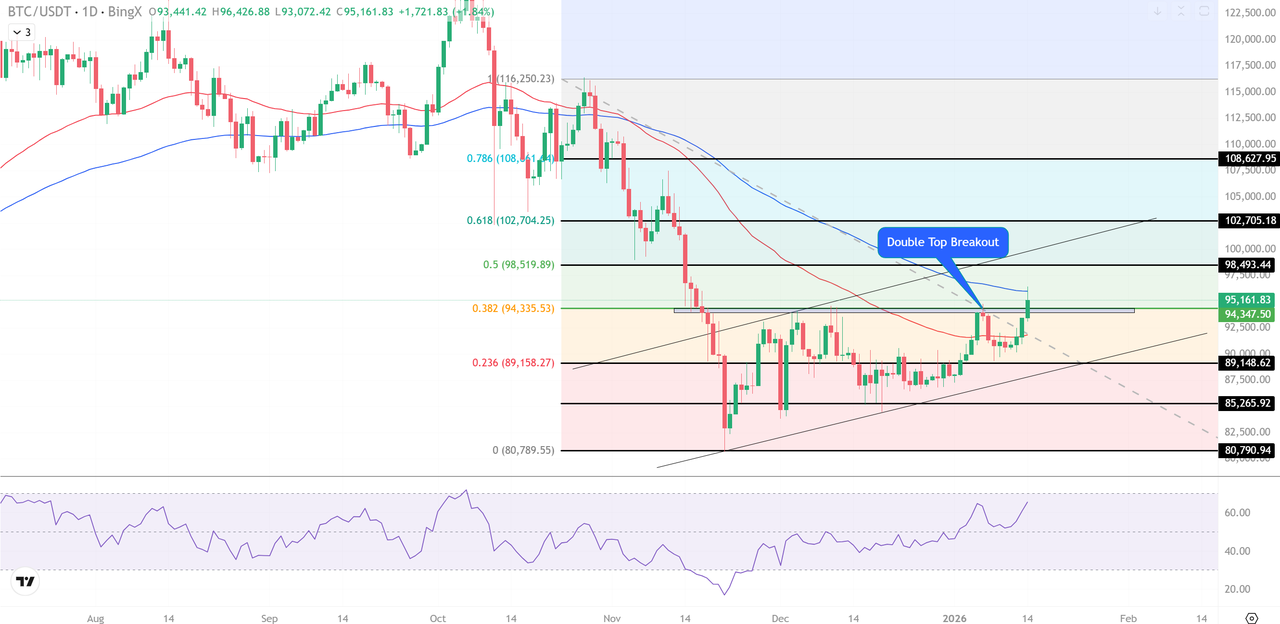
Bitcoin (BTC/USD) Price Chart - Source: BingX
As shown in the open interest chart, Bitcoin futures open interest remained elevated heading into the CPI release, climbing toward $66–$67 bn as price began to rise.
This indicated that traders were still holding large leveraged positions rather than de-risking. Leverage stayed in the system as price moved higher.
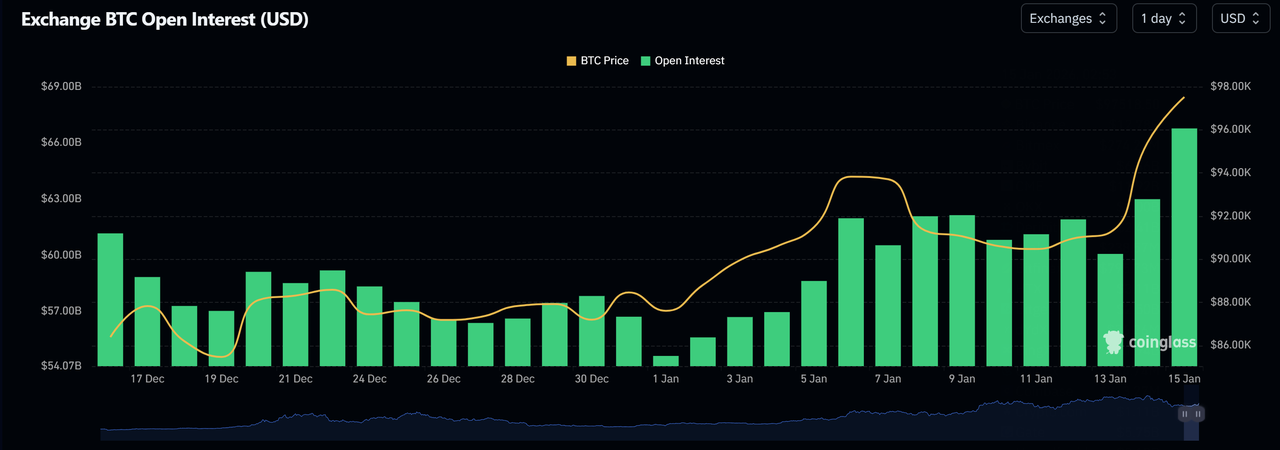
Bitcoin Open Interest (USD) - Source: Coinglass
At the same time, the funding rate chart shows funding drifting toward zero and turning negative on several major exchanges in the sessions before and during the CPI release. Negative funding meant short traders were paying to maintain positions, a clear sign of bearish crowding.
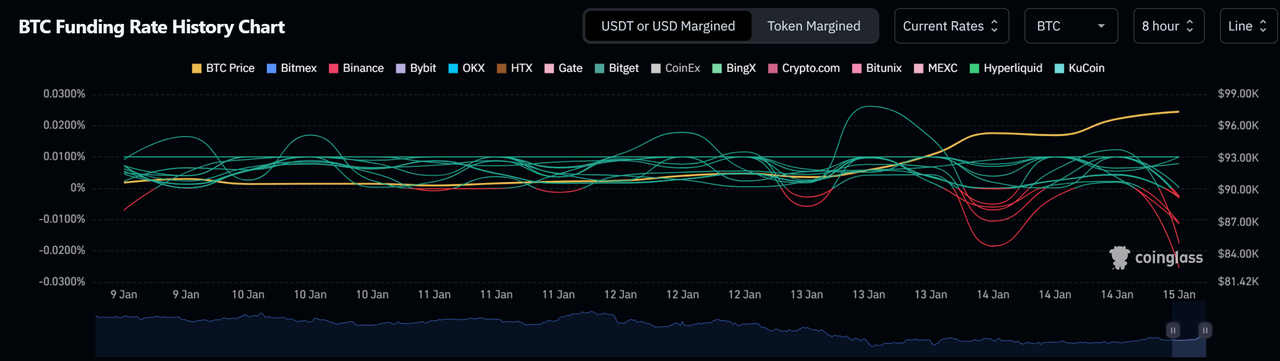
Funding Rate - Source: Coinglass
That combination proved unstable:
• High open interest confirmed leverage was concentrated
• Negative funding showed shorts dominated positioning
• CPI-driven upside pushed price through key levels
Once BTC broke higher, short positions were forced to buy back. That forced buying, not fresh optimism, accelerated the rally and triggered a wave of liquidations across the market.
In crypto, macro news starts the move. Crowded leverage decides how far and how fast it runs.
How to Read Liquidation Data and Spot Early Warning Signals
Liquidation data helps traders spot pressure building beneath the surface before sharp price moves. Analytics platforms track forced liquidations across major exchanges in real time, giving market participants a clear view of where leveraged trades are becoming unstable. This data doesn’t predict direction, but it highlights when volatility risk is rising.
There are a few simple warning signs to watch:
• Rising open interest: Shows traders are adding leverage instead of exiting. If price stalls while open interest keeps climbing, positions are becoming crowded.
• Extreme funding rates: Negative funding suggests many traders are short. Very high positive funding means longs are crowded. Both signal imbalance.
• Tight liquidation clusters: When many traders share similar liquidation levels, price becomes vulnerable to fast moves.
For example: If Bitcoin trades near $95,000, funding is negative, and open interest is elevated, a move above $96,000 can trigger short liquidations. Forced buybacks then push price higher, setting off more liquidations in a chain reaction.
For market participants, these early warnings help manage risk before volatility erupts, rather than chasing moves after they’ve already happened.
Risk Management in Crypto Futures: How Traders Avoid Getting Wiped Out
In crypto, most losses don’t come from being wrong on direction. They come from being right too early with too much leverage. Price can move against you before your thesis plays out, and leveraged markets don’t give second chances.
The simplest defense is low leverage. Using 2x–5x instead of 20x–50x dramatically lowers liquidation risk. For example, a 3% Bitcoin move is normal daily volatility. At 50x leverage, that’s enough to wipe out a position completely. At 3x, it’s just noise.
Capital preservation matters more than catching every move. Professional traders size positions, so a single loss costs 1–2% of their account, not 30–50%. This allows them to survive clusters of losing trades and volatile news days like CPI releases.
Practical risk rules traders use:
• Know your liquidation price before entering, not after
• Reduce leverage ahead of major data or events
• Use stop-losses early, not when panic sets in
• Avoid adding to losing trades during high volatility
Large liquidation events expose poor discipline. Overleveraged traders freeze or hope. Disciplined traders exit early and live to trade the next setup. In crypto, survival is the edge.
How Crypto Traders Enter and Exit Liquidation-Driven Squeezes
Liquidation squeezes often start when price breaks above a key resistance and enters a liquidation zone. Traders look for rising volume, a surge in short liquidations, and funding rates lifting from deeply negative levels. For example, if BTC breaks above $100,000 and short liquidations spike while funding moves from −0.02% toward zero, it signals forced buying is underway.
Entries are typically taken after price holds above the breakout level for confirmation. Momentum can accelerate quickly as price moves through stacked liquidation levels.
Exit signals appear when liquidation pressure fades:
• Short liquidation volume drops sharply
• Relative Strength Index (RSI) pushes above 70 and stalls
• Long upper wicks form near resistance (e.g., $103K–$105K)
Risk control matters most. Use low leverage (2x–5x), define stops early, and avoid chasing vertical candles. Once liquidations slow, the squeeze is often near exhaustion.
Key Takeaways: How to Stay Ahead of Liquidation-Driven Moves
Sudden crypto surges are rarely random. They’re driven by leverage, crowded positioning, and forced liquidations reacting to macro triggers. Traders who track funding rates, open interest, and liquidation zones understand why moves accelerate and avoid chasing late entries. The edge isn’t prediction. It’s preparation and disciplined risk control.
To stay ahead of these moves, use platforms that offer real-time derivatives data, clear liquidation insights, and flexible risk tools. BingX gives traders the visibility and control needed to trade volatile markets with confidence, not emotion.