
Pivot points, support, and resistance are key tools in crypto trading used to identify price levels, plan entries and exits, and manage risk effectively. This article will show you how to identify, calculate, and apply these levels in crypto trading, helping you make smarter, data-driven decisions whether you're scalping Bitcoin or swing trading altcoins.
In the highly volatile world of cryptocurrency markets, traders constantly seek reliable tools to navigate unpredictable price swings. Statistical data shows that crypto volatility is significantly higher than in traditional markets, with Bitcoin's historical volatility often exceeding a 4% daily standard deviation during active market phases. This extreme variability creates both challenges and opportunities for crypto traders. Among the most effective tools in technical analysis are pivot points, support, and resistance levels.
These are the time-tested indicators that bring structure to market chaos. Used for decades in traditional finance, these levels are anchored in trader psychology: price zones where significant buying or selling occurred tend to influence future behavior through a phenomenon known as psychological anchoring.
Support and resistance levels act as invisible price barriers that contain market movements, while pivot points offer mathematically derived reference levels to anticipate where those barriers may emerge. Combined with each other, these technical indicators create a robust framework for spotting reversal zones, breakout points, and profit targets.
What Are Support and Resistance Levels in Crypto Trading?
In cryptocurrency trading, support and resistance levels are used to mark areas where the price tends to react. These are not just random points. They are levels where buyers or sellers have shown strong interest in the past.
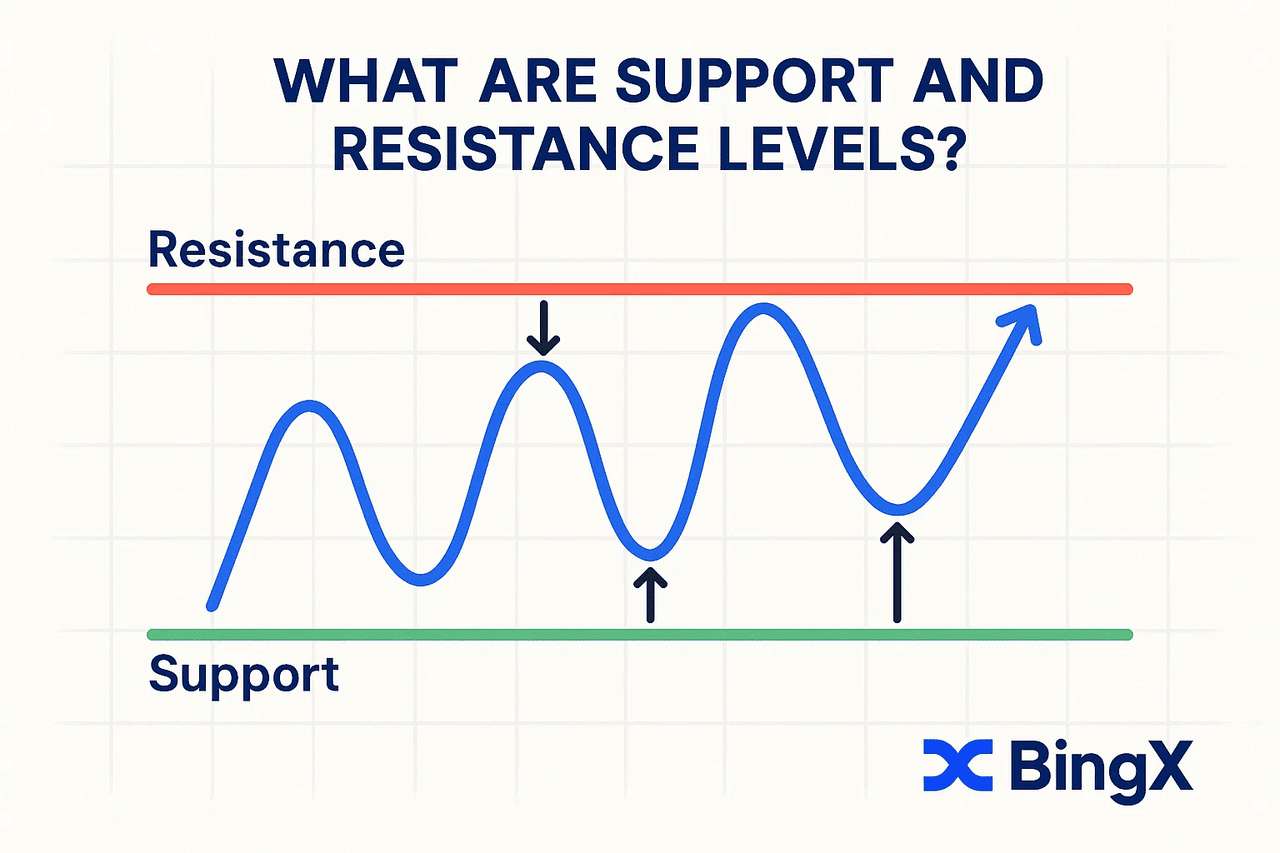
• Support is the price level at which cryptocurrency tends to stop falling and start rising again. This happens because buyers see value at that price and step in. Think of support as a floor that catches falling prices. When Bitcoin drops to $90,000 and buyers step in, preventing further decline, that $90,000 level becomes support. The more times the price bounces from this level, the stronger the support becomes.
• Resistance levels work the opposite way. Resistance is the level where the price often stops rising and starts falling. At this point, many sellers enter the market to take profit or open short positions. When Bitcoin rises to $105,000 several times but can't break through, sellers may be creating resistance at that level.
Why do these levels work? It's mostly about trader psychology.
When prices approach previous support or resistance levels, traders often recall what happened the last time and tend to make the same decisions again. If many traders sold Bitcoin at $105,000 before, they might do so again, creating resistance. Support can also become resistance after it breaks.
For example, if Bitcoin falls below the $90,000 support level, that level might become resistance when the price tries to climb back above it later.
Many traders closely monitor these levels and place buy orders near support levels or sell orders near resistance levels. This creates a self-fulfilling pattern in which key price levels influence market trends in predictable ways.
What Are Pivot Points and How to Calculate Them?
Pivot points are calculated reference prices that traders use to identify potential support and resistance levels for the current trading day or period. Unlike regular support and resistance that form naturally through price action, pivot points use a formula based on previous price data.
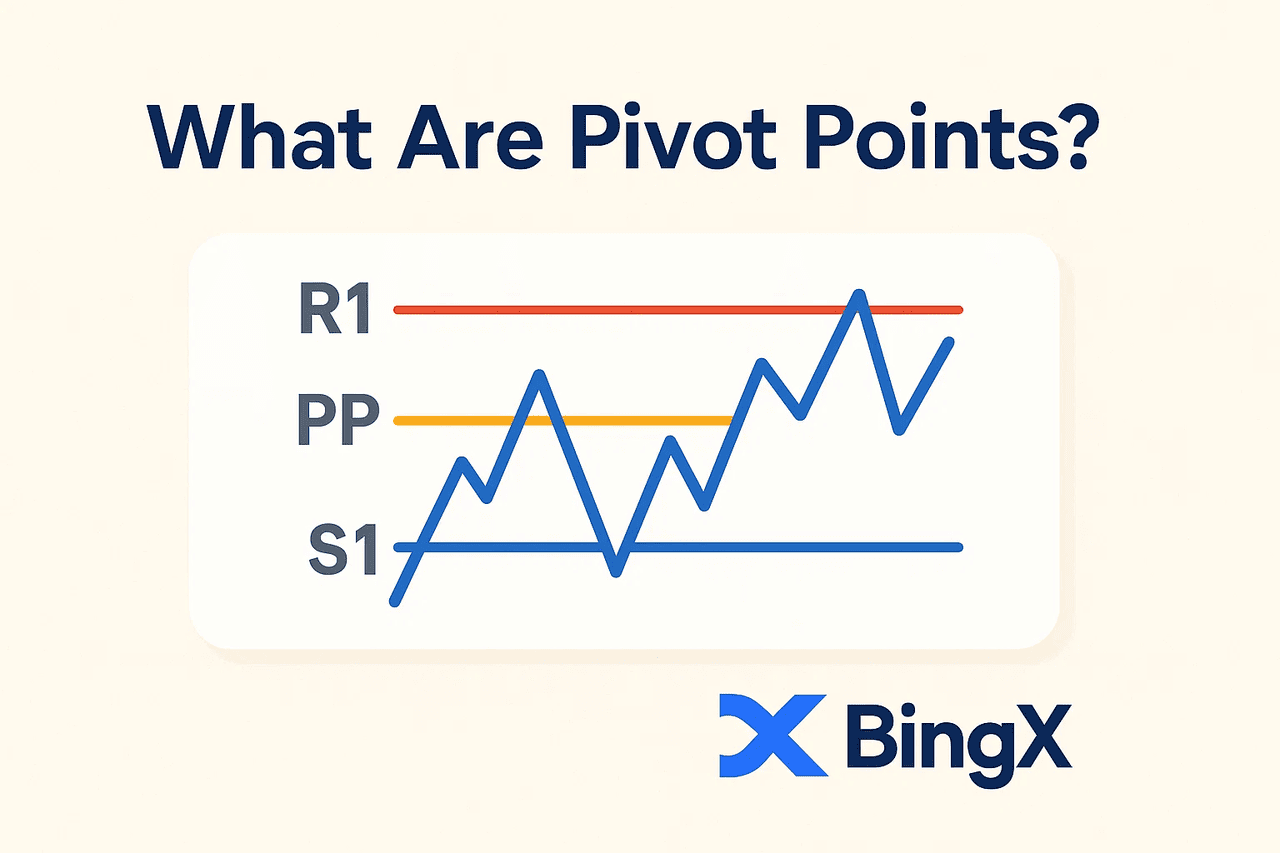
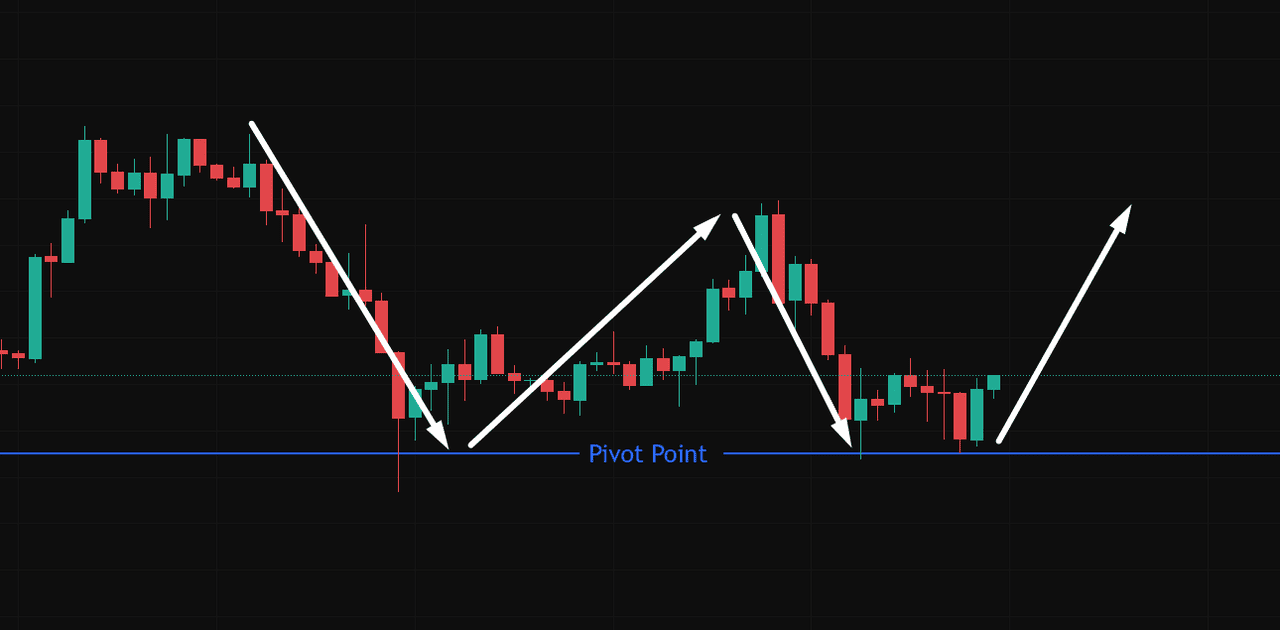
The main pivot point serves as a central reference point dividing bullish and bearish territory. When price trades above the pivot point, the market sentiment is considered bullish. When it trades below, the sentiment is bearish.
What makes pivot points special is that they're precalculated before the trading day begins. This gives traders advance notice of potential reversal zones rather than waiting for price patterns to develop. They're like road signs for the trading day, showing where the price might pause, turn around, or break through.
 Source: BTC/USD Trading Chart on BingX
Pivot points have been used in stock markets for decades, but they work especially well in cryptocurrency markets where technical analysis often drives trading decisions.
Since crypto exchanges operate 24/7, traders typically calculate new pivot points at the same time each day, often using UTC midnight as the cutoff.
While many technical indicators can be subjective, pivot points offer objective levels based solely on mathematical calculations, making them popular among both novice and experienced traders.
How to Combine Pivot Points with Support and Resistance Levels
Using support, resistance, and pivot points together can give crypto traders a more reliable way to plan entries and exits. While each level is useful on its own, combining them increases the chances of identifying high-probability setups.
One common method is to look for confluence, when multiple levels line up near the same price. For example, if the daily pivot point is close to a known support level, that zone may offer a stronger chance for a bounce.
 Source: BTC/USD Trading Chart on BingX
From the Chart Example:
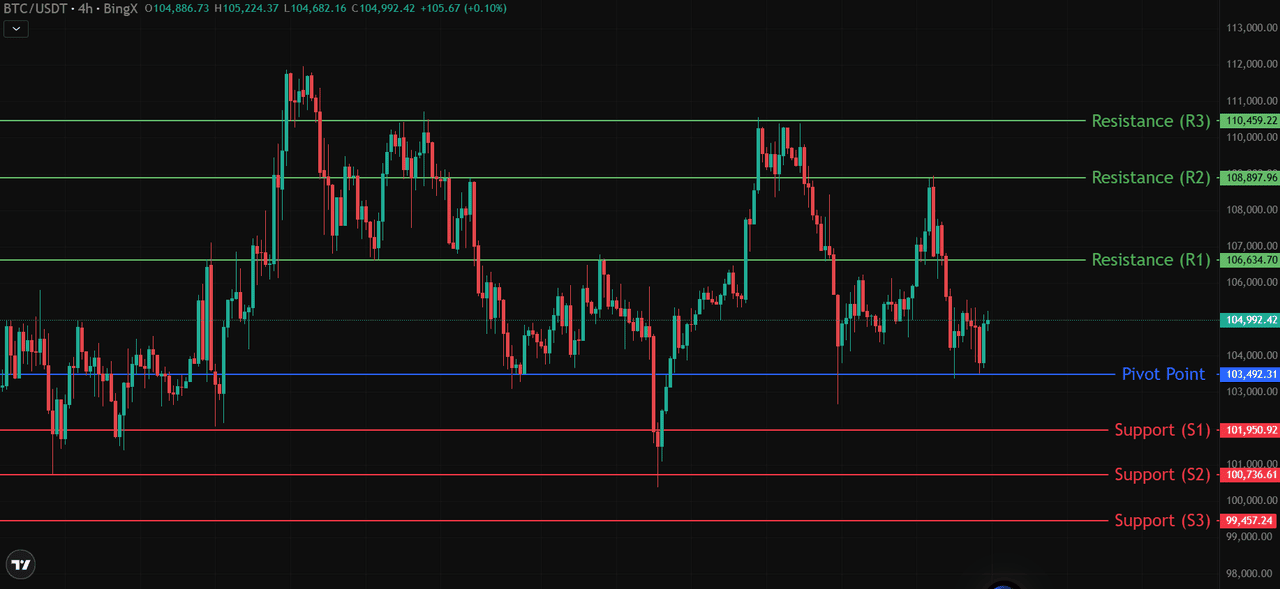
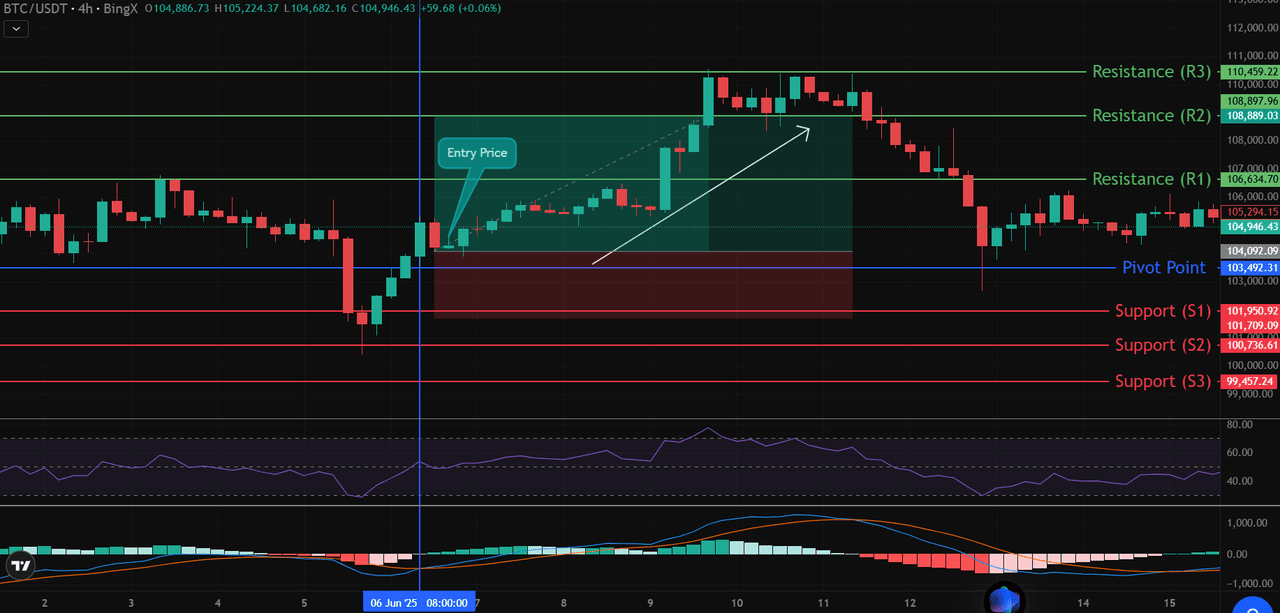
Looking at the BTC/USDT 4-hour chart on BingX:
• Pivot Point (PP): $103,492.31
• Support 1 (S1): $101,950.92
• Resistance 1 (R1): $106,634.70
If Bitcoin were to pull back and retest the pivot point near $103,492, and at the same time, show a bullish candlestick pattern, that area could be a low-risk buying opportunity. The pivot provides a technical reference, while nearby support and price structure add confirmation.
Likewise, if BTC rallies toward R1 at $106,634 but stalls or shows a rejection candle, traders might look to exit long positions or even consider a short entry. This strategy uses higher resistance levels to plan exits or reversals.
When price reacts near these levels, it gives traders structure in an otherwise volatile market. Combining tools like this helps reduce guesswork and improves consistency when you trade cryptocurrencies.
How to Combine Pivot Points with Other Technical Indicators
While pivot points and support/resistance levels offer strong trading references, they become much more effective when used alongside other technical tools like the Relative Strength Index (RSI), Moving Average Convergence Divergence (MACD), and volume analysis.
Take this BTC/USDT 4-hour chart from BingX as an example:
On June 6, Bitcoin dipped below Support 1 (S1) at $101,950.92, then rebounded strongly above the pivot point at $103,492.31. This created a possible long setup, but it wasn’t the pivot alone that made the case strong.
 Source: BTC/USD Trading Chart on BingX
Traders who looked at the RSI noticed it was rising from oversold territory, suggesting upward momentum was building. At the same time, the MACD indicator flashed a bullish crossover, where the MACD line moved above the signal line. These two confirmation signals, along with the price action around the pivot, made it a compelling point to enter a long trade.
Why combine multiple trading tools?
• Pivot levels show where price may react
• RSI confirms if price is overbought/oversold
• MACD reveals trend momentum and crossover signals
• Volume supports the strength behind breakouts or reversals
Many cryptocurrency exchanges now include these tools in their charts. Whether you’re trading on a phone or using crypto wallets, combining indicators makes decisions clearer. Even financial institutions rely on similar methods to monitor trades and record transactions securely through blockchain technology.
As outlined in technical guides by John Wiley & Sons, using multiple tools together is a key strategy for improving trading consistency in both traditional and digital markets.
Conclusion
Understanding support, resistance, and pivot points is essential for anyone serious about improving their crypto trading. These tools help simplify decision-making by identifying key levels where price movement may pause, reverse, or accelerate, giving structure to even the most volatile charts.
By applying this knowledge to real-time trades, traders can better manage risk, time their entries and exits, and reduce emotional decision-making. Whether you're trading Bitcoin, altcoins, or exploring new digital assets, mastering these concepts will strengthen your overall strategy.
As Satoshi Nakamoto's vision for the first cryptocurrency unfolds, the cryptocurrency space continues to evolve, powered by blockchain technology, decentralized systems, and the ongoing process known as mining. With no central bank controlling supply, this virtual currency environment rewards those who learn, adapt, and act with confidence.
Start practicing today on BingX, where you can access advanced trading tools, real-time charting, and the features needed to grow your skills in a fast-moving market.
Related Reading
5. Simple Moving Average(SMA) vs Exponential Moving Average(EMA) in Crypto Trading: Differences to Know
FAQs on Pivot Points
1. What is a pivot point in crypto trading?
A pivot point is a calculated price level used to identify potential support and resistance zones. It’s based on the previous trading session’s high, low, and closing prices. Traders use pivot points to spot likely reversal or breakout areas on the chart.
2. Can you use pivot points on intraday charts?
Yes, pivot points are often used on intraday charts like 1-hour, 4-hour, or 15-minute timeframes. They're especially useful for day traders and scalpers looking to react to short-term price movements.
3. Are support and resistance levels reliable in crypto markets?
Support and resistance levels are widely used and respected in crypto trading. While no level is guaranteed to hold, they often align with areas of high trader activity and can provide useful signals, especially when combined with volume or other indicators.
4. Do these levels work on many exchanges or only major ones?
Yes, these levels are applicable across most cryptocurrency exchanges, whether major platforms like BingX or smaller trading venues. Since they’re based on price data, their relevance remains consistent across the board.
5. How are pivot points different from moving averages?
Pivot points are static levels calculated daily, whereas moving averages change constantly in response to price movements. Pivot points provide predefined zones to plan around, while moving averages indicate the overall trend direction over time.