
Meta Description: The Average True Range (ATR) measures crypto asset's price volatility. Learn how to use ATR for breakout signals, risk management, and sizing trades.
The Average True Range (ATR) is a powerful technical analysis indicator developed by J. Welles Wilder Jr. and introduced in his 1978 book "New Concepts in Technical Trading Systems." Unlike many popular technical indicators, ATR doesn't predict price direction but instead measures market volatility, making it an essential tool for risk management and volatility trading in the crypto market.
The ATR indicator adapts to different market conditions and timeframes, providing valuable insights into an asset's volatility levels. This adaptability makes it particularly useful across various financial markets, including cryptocurrencies, foreign exchange (forex), stocks, indices, and commodities. Traders can analyze ATR on daily, weekly, or monthly charts, or even use it for intraday analysis on minute-by-minute charts.
Its ability to adjust to shifting market conditions makes ATR a core tool in volatility-based strategies and risk management systems.
What Is the Average True Range (ATR) Trading Indicator?
The Average True Range (ATR) measures the average price range of an asset over a specified period, typically 14 periods, taking into account gaps and intraday volatility. This value reflects the average volatility over that timeframe, whether it's on a daily, hourly, or minute-by-minute chart, depending on the trader’s chosen timeframe.
Higher ATR values indicate increased volatility, suggesting more dramatic price movements, while lower values reflect decreased volatility and more stable price action. As a volatility indicator, the ATR shows how much a price fluctuates on average over a given time frame. When ATR values are high, it indicates large and rapid price fluctuations.
Conversely, low ATR values are typical during periods of sideways movement or consolidation that occur at market tops or during consolidation phases.
How to Calculate the Average True Range (ATR)
Before we dive into the calculations, let us reassure you that you don’t need to memorize formulas to use the ATR indicator effectively—but if you're curious about how it's calculated and want to understand what drives it, here’s a quick breakdown.
The Average True Range (ATR) is calculated through a two-step process that begins with finding the True Range (TR) for each period. The True Range represents the greatest of three price measurements :
1. Today's high minus today's low
2. Absolute value of today's high minus the previous close
3. Absolute value of today's low minus the previous close
This approach ensures that the TR captures volatility from gaps between trading sessions and limit moves, which a simple high-low calculation would miss.
In mathematical form, the True Range formula is:
TR = Max[(High − Low), |High − Previous Close|, |Low − Previous Close|]
Once the True Range values are determined, the Average True Range is calculated as a moving average of these values over a specified number of periods (n), typically 14 days as recommended by Wilder.
For the first ATR calculation:
First ATR = (Sum of TR values over n periods) / n
For subsequent calculations, Wilder used a smoothing method:
Current ATR = [(Previous ATR × (n − 1)) + Current TR] / n
Example Calculation
Let’s walk through a simplified 3-period ATR calculation using historical BTC/USDT data:
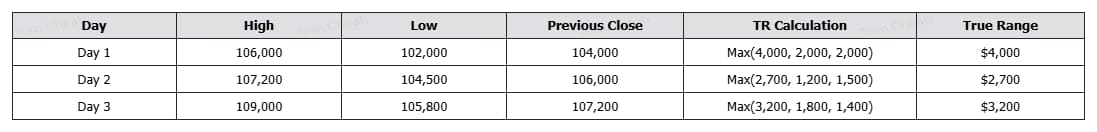
First ATR (3-period average): (4,000 + 2,700 + 3,200) / 3 = $3,300
If Day 4 TR = $2,900, the next ATR is: [(3,300 × 2) + 2,900] / 3 = $3,167
This method balances short-term volatility (such as a sudden BTC rally) with historical data to provide a more stable view of the market's mood.
How to Apply the ATR Indicator on BingX
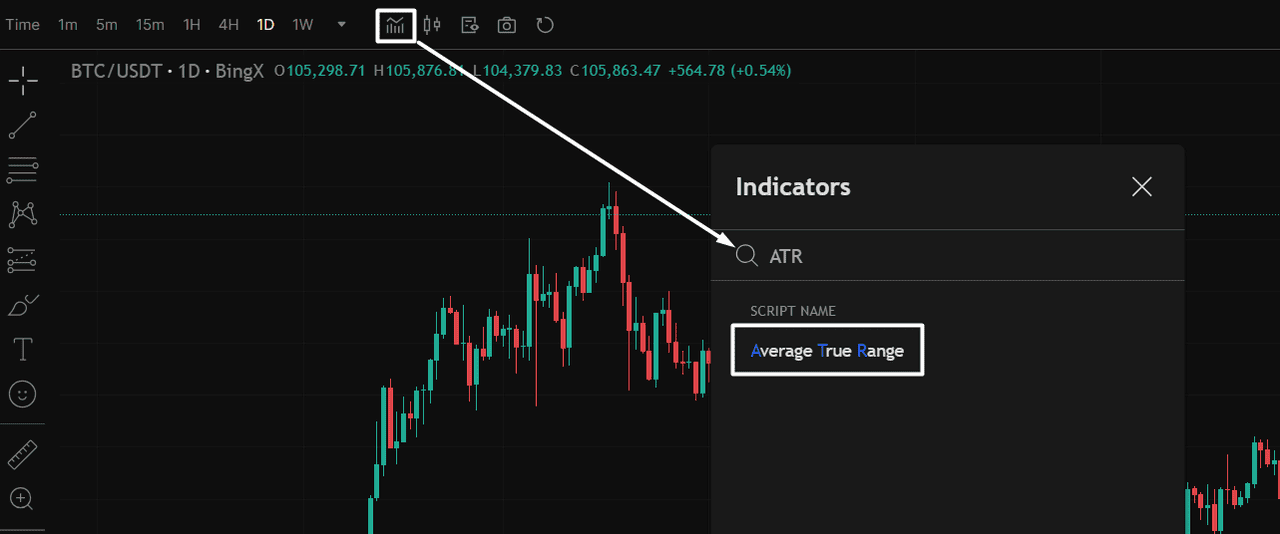
Before using the Average True Range (ATR) in your strategy, you first need to add it to your BingX chart.
Add ATR to Your Chart: Open a trading pair, such as BTC/USDT, on BingX. Then click the Indicators icon at the top of the chart, as indicated on the chart below. To make it an easy search, simply type “ATR” in the search bar and select Average True Range from the dropdown.
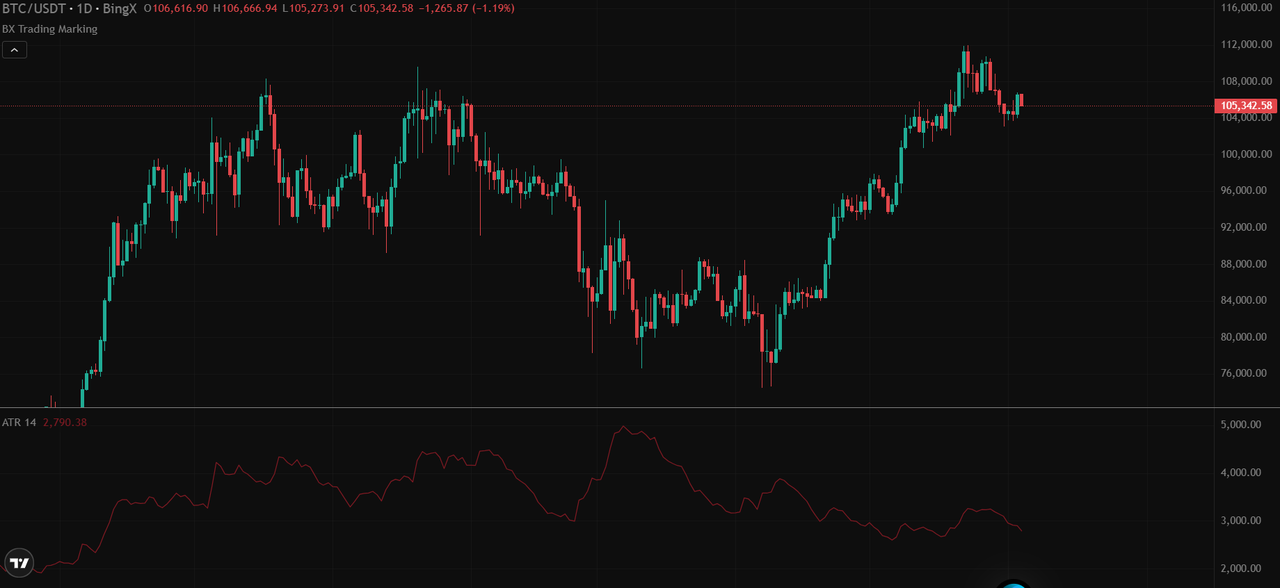
Once added, the ATR line will appear in a separate pane below your chart, displaying real-time volatility levels for your chosen timeframe.
 Source: BTC/USDT Trading Chart on BingX
How to Interpret ATR Values
The Average True Range (ATR) measures market volatility, not price direction. Understanding its levels helps you adjust your trading approach based on market conditions.
High ATR Values: High ATR readings signal increased volatility and wide price swings—common during breakouts, strong trends, or news-driven moves. A rising ATR with price reversal often confirms momentum in the new direction.
Low ATR Values: Low readings suggest calm market conditions, usually during sideways consolidation, range-bound trading, or before major breakouts. These periods often precede larger moves.
Neutral to Direction: ATR shows the size of price movement, not whether it’s bullish or bearish. Always use it alongside trend indicators for confirmation.
How do you use ATR in your trading strategy?
Now that you understand what ATR tells you, let’s see how to actually use it in your crypto trading, from calculating position size to spotting breakouts and setting stops either in spot or futures market.
Control Risk and Size Your Trades Using ATR
The Average True Range indicator serves as a versatile tool that can significantly enhance your comprehensive trading strategy when properly integrated. By measuring volatility objectively, ATR provides valuable insights for several key aspects of trading:
1. Position Sizing with ATR
One of ATR's most powerful applications is position sizing and risk management, and it applies to both spot and futures trading. By incorporating ATR values into position size calculations, traders can adjust their exposure based on current market volatility:
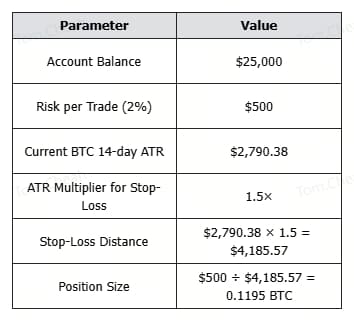
Position Size (in BTC) = Risk per Trade ÷ (ATR × Multiplier)
 Source: BTC/USDT Trading Chart on BingX
1. Determine your risk tolerance per trade (e.g., 1-2% of your account)
2. Set stop-loss distance as a multiple of ATR (typically 1-3× ATR)
3. Calculate position size by dividing the risk amount by the stop-loss distance
Why It Matters
• In high volatility, ATR increases, reducing position size to protect capital.
• In low volatility, ATR decreases, allowing for a larger position while maintaining the same risk.
• This approach keeps risk exposure constant, regardless of Bitcoin’s price fluctuations or volatility spikes.
By using ATR for position sizing, crypto traders can better align their strategy with current market conditions, enabling smarter risk control in both calm and turbulent periods.
Use ATR for Breakouts, Trailing Stops, and Channels (Entry/Exit Signal)
The Average True Range (ATR) doesn’t predict price direction, but it helps identify when volatility is high enough to validate a trade setup. When combined with support/resistance levels, moving averages, or price patterns, ATR becomes a key tool in confirming breakout entries and managing exits.
1. Volatility Breakouts
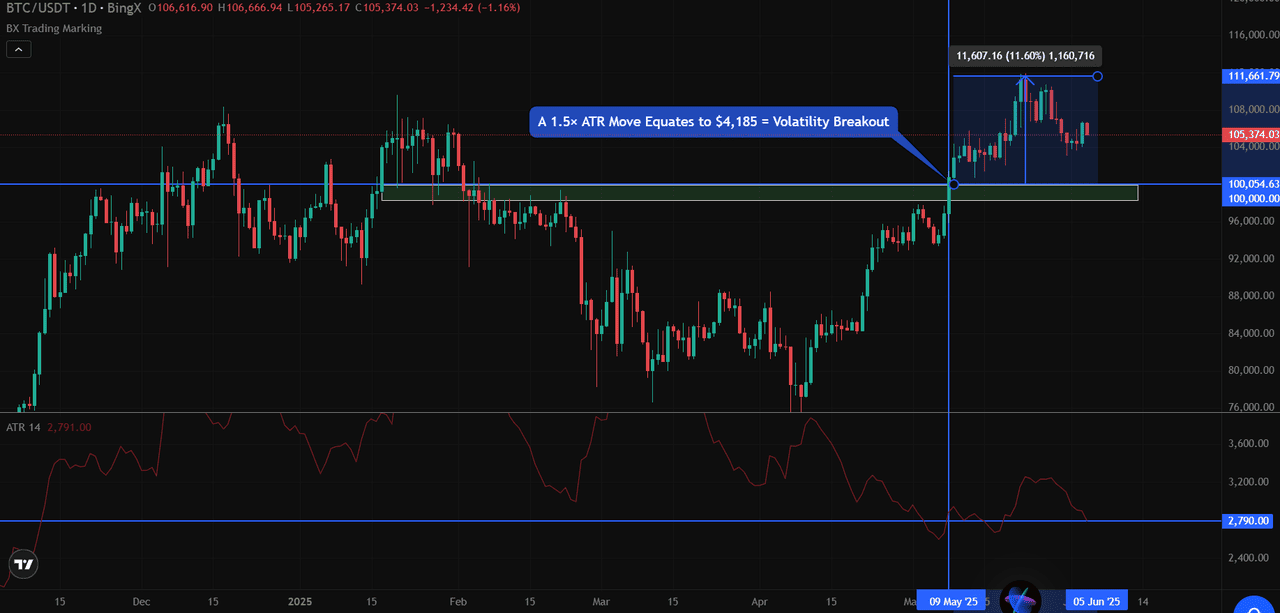
When price breaks above a key level by more than a multiple of the ATR, typically 1.5× or 2× ATR, it often signals a high-conviction move.
For example, in the BTC/USDT chart, Bitcoin surged past the $100,000 resistance with a strong daily close above it. At the time, the 14-day Average True Range (ATR) was approximately $2,790.
A 1.5× ATR move equates to $4,185.
 Source: BTC/USDT Trading Chart on BingX
Since BTC broke above $100K and closed near $105,000+, this exceeded the ATR threshold, validating a potential volatility breakout with momentum.
Breakout Confirmation Rule: Close above resistance + move > 1.5× ATR = Valid breakout
2. Use ATR in Trailing Stop Strategy
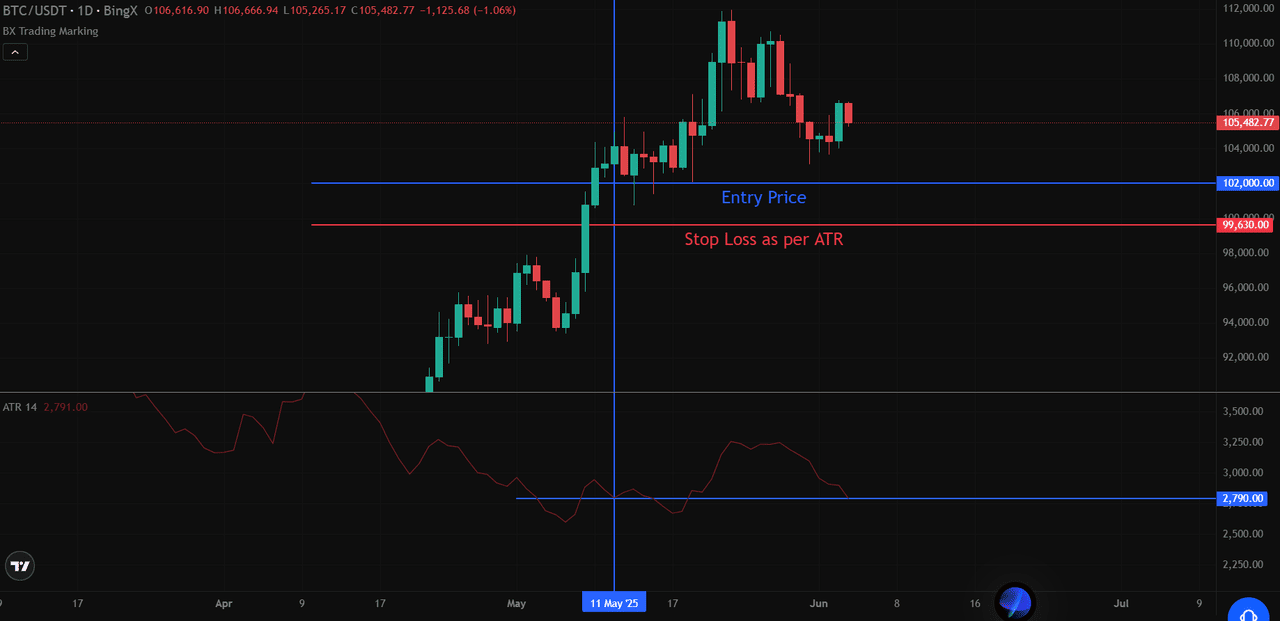
A trailing stop based on ATR, placed below recent highs for long positions or above recent lows for short positions.
• For long positions: Stop = Highest high since entry − (ATR × multiplier)
• For short positions: Stop = Lowest low since entry + (ATR × multiplier)
 Source: BTC/USDT Futures Trading Chart on BingX
Let’s say you entered long at $102,000, and BTC has since reached a high of $108,000. Using a 3× ATR trailing stop: Stop-Loss = 108,000 − (2,790 × 3) = $99,630
This stop adjusts with new highs but allows for breathing room, essential during Bitcoin’s volatile swings. On spot markets, this method works only for long positions, while on futures, it applies to both long and short trades.
3. Identify Dynamic Support/Resistance Bands with ATR Channels
ATR Channels add and subtract the ATR from a moving average (e.g., 20-day EMA) to create adaptive bands that reflect current volatility. These bands can signal potential reversal zones or areas of increased volatility.
Example: If BTC’s 20-day EMA is at $104,000 and the ATR is $2,790:
• Upper Band = 104,000 + 2,790 = $106,790
• Lower Band = 104,000 − 2,790 = $101,210
If price nears either band with strong momentum and volume, traders watch for potential trend continuation or exhaustion, depending on confirmation signals (e.g., candle patterns or volume divergence).
4. Filtering False Breakouts
ATR helps traders distinguish between significant breakouts and false moves by confirming whether sufficient volatility supports the price action:
• True breakouts typically feature expanding ATR values, indicating increased market participation
• False breakouts often show divergence between price movement and ATR (price breaks out but ATR remains flat or decreases)
• Requiring both price action and ATR confirmation reduces the likelihood of being caught in failed breakouts
By incorporating ATR into your decision-making process, you can develop more robust trading strategies that adapt to changing market conditions while maintaining disciplined risk management.
This volatility-aware approach helps protect capital during turbulent periods while capitalizing on genuine trading opportunities.
ATR vs. Other Technical Indicators
While the Average True Range (ATR) shares the technical analysis landscape with many other indicators, it stands apart due to its unique focus on measuring volatility rather than price direction. This fundamental difference makes ATR complementary to other popular indicators that serve different analytical purposes.
1. ATR vs. Momentum Indicators
Unlike the Relative Strength Index (RSI), which measures the speed and change of price movements to identify overbought or oversold conditions, ATR solely focuses on the magnitude of price movement without regard to direction.
 Source: BTC/USDT Trading Chart on BingX
In the chart example, we can see how RSI fluctuates between overbought and oversold levels (typically above 70 and below 30), while ATR increases regardless of whether prices are rising or falling, it simply reflects the size of the moves.
When RSI indicates overbought conditions while ATR is rising, it might suggest a strong trend that could continue despite appearing overextended. Conversely, a low ATR with extreme RSI readings might indicate a less reliable signal.
2. ATR vs. Trend Indicators
While Moving Averages help identify trend direction by smoothing price action, ATR measures the volatility component of market behavior. Moving averages tell you which way prices are likely headed, whereas ATR tells you how bumpy the ride might be.This distinction becomes particularly valuable when:
• A moving average shows a clear uptrend, but falling ATR suggests momentum may be waning
• Price breaks above a moving average with expanding ATR, potentially confirming a strong breakout
• Price consolidates near moving averages with contracting ATR, often preceding significant moves
Unlike the Relative Strength Index (RSI) or Moving Averages, which are designed to measure momentum or price direction, the Average True Range (ATR) focuses purely on volatility. It doesn’t indicate whether the price will rise or fall; it tells you how much the price is likely to move, regardless of direction.
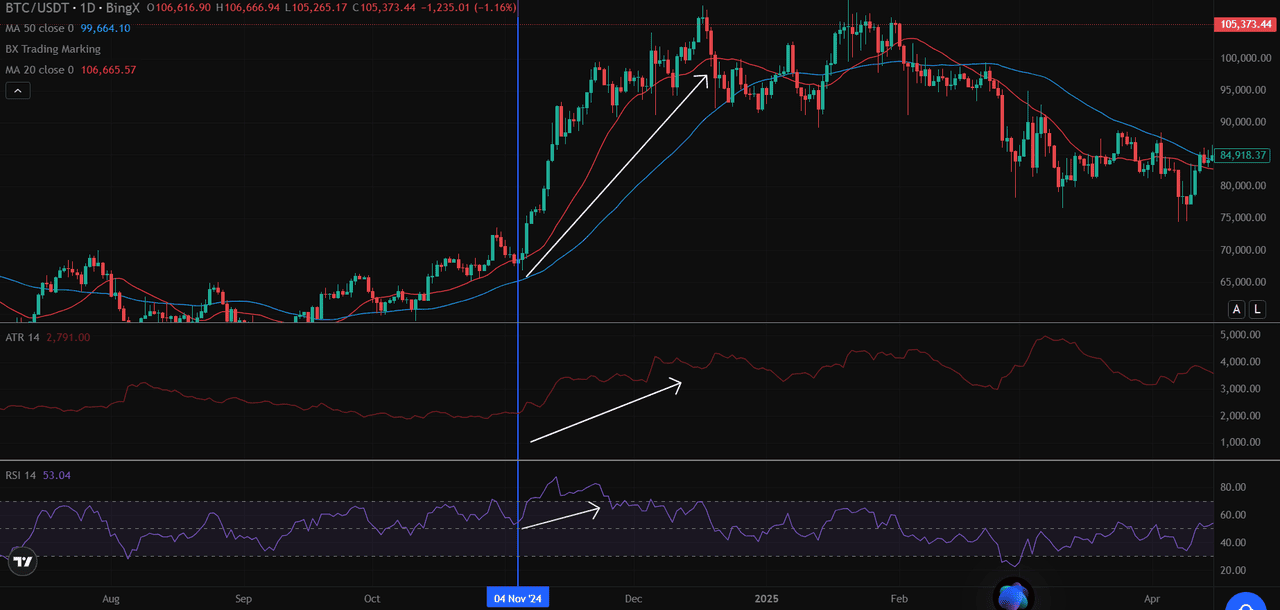 Practical Example - Source BTC/USDT Trading Chart on BingX
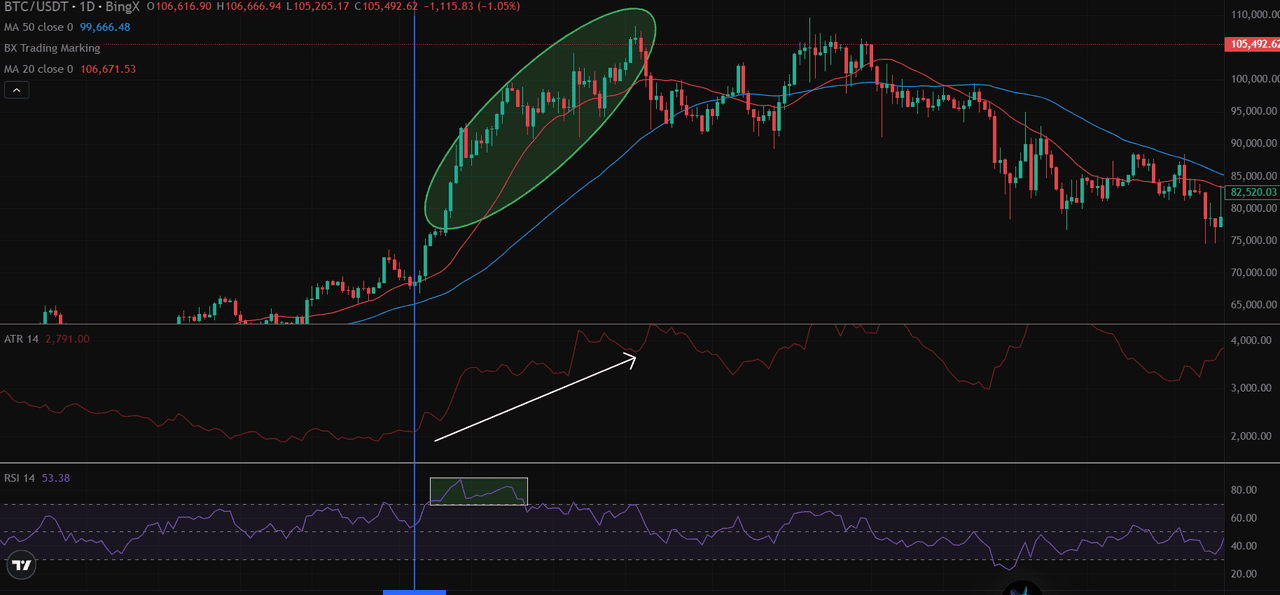
In the BTC/USDT daily chart above, you can see that as Bitcoin breaks above the 20- and 50-day moving averages, the ATR also rises, reflecting increased market activity and range expansion. At the same time, the RSI crosses 50, confirming bullish momentum.
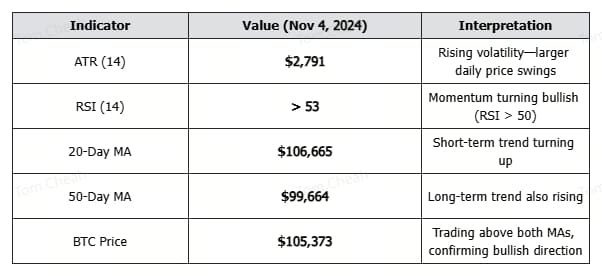
At this point, all three indicators align:
• ATR is expanding → confirms increased volatility
• RSI is rising above 50 → signals bullish momentum
• Price is above both MAs → confirms trend direction
While ATR excellently captured Bitcoin's volatility increase during the rally, only by combining it with the directional guidance from moving averages and the momentum confirmation from RSI could traders make fully informed decisions about market opportunities and risks.
What Are the Limitations of the ATR Indicator?
Despite its usefulness, the Average True Range indicator has several significant limitations that traders should understand before incorporating it into their strategies.
1. First and foremost, ATR is not predictive of price direction; it simply measures volatility magnitude without indicating whether prices will rise or fall. As seen in the BTC/USDT chart, ATR increased dramatically during both the November 2024 rally and the subsequent December decline.
2. ATR is fundamentally a lagging indicator based on historical price data, which means it reflects what has already happened rather than what will happen next. The 14-period ATR calculation places equal weight on recent and older price movements within the calculation window, potentially dulling sensitivity to immediate market changes.
3. During extended sideways price action with minimal volatility, ATR values can become extremely compressed, making it difficult to differentiate meaningful changes in volatility. This is particularly problematic in low-volume assets or during periods of market consolidation, where small price movements can trigger false signals.
It's crucial to remember that past performance is no guarantee of future results. While ATR helps quantify historical volatility patterns, markets can change behavior rapidly and unexpectedly.
Final Thoughts
While ATR doesn’t predict direction, it remains one of the most effective tools for managing trades based on volatility. It helps traders size positions, set dynamic stops, and avoid low-conviction setups. When combined with trend indicators like moving averages or RSI, ATR adds a critical layer of risk control to any crypto trading strategy, especially in fast-moving markets like Bitcoin.
Want to apply ATR-based strategies with real-time data?
Start trading on BingX, access advanced charting tools, customizable ATR settings, and BTC/USDT technical analysis all on one platform.
Related Reading
5. Simple Moving Average(SMA) vs Exponential Moving Average(EMA) in Crypto Trading: Differences to Know
Average True Range (ATR) FAQs
1. What is the Average True Range (ATR) indicator?
The ATR is a technical indicator that measures market volatility by calculating the average range between high and low prices over a set period, typically 14 days.
2. Does ATR show price direction?
No. ATR is direction-neutral. It shows how much price is moving, not whether it’s going up or down. It should be used alongside trend indicators like moving averages.
3. How can I use ATR for position sizing?
Use this formula:
Position Size = Risk per Trade ÷ (ATR × Multiplier)
This adjusts your trade size to current volatility. Higher ATR = smaller position.
4. What does a high ATR value mean in crypto?
A high ATR indicates increased volatility. For Bitcoin, this often follows news events, breakouts, or market reversals. It means price swings are larger than usual.
5. What’s a volatility breakout using ATR?
A volatility breakout happens when price moves beyond a key level (like resistance) by 1.5× or 2× ATR, confirming strong market momentum behind the move.
6. How does ATR differ from RSI or Moving Averages?
ATR measures volatility, while RSI measures momentum and Moving Averages show trend direction. Using them together offers a more complete trading setup.
7. Can ATR be used for crypto day trading?
Yes. ATR can be applied to short timeframes (e.g., 5-min, 15-min) for intraday trading, helping to filter low-volatility setups and manage risk in real time.