
Meta Description: Evening Star Pattern is a compelling bearish reversal setup in cryptocurrency trading. Learn how to identify the evening star candlestick pattern, confirm it using indicators, and apply it for effective market timing.
In the high-tech world of cryptocurrency trading, traditional candlestick patterns remain remarkably relevant analytical tools. These visual representations of price action continue to offer valuable insights into market psychology and potential trend changes. Among these formations, reversal signals are particularly crucial in volatile crypto markets where sentiment can shift rapidly.
The Evening Star pattern stands out as a powerful bearish reversal pattern that can help traders anticipate potential market tops. In an environment where timing is everything, understanding this three-candle formation can provide crypto traders with a significant edge in navigating market transitions and protecting profits during downturns.
What Is the Evening Star Candlestick Pattern?
The Evening Star is a distinctive three-candle bearish reversal pattern that forms at the end of an uptrend, signaling a potential shift from bullish to bearish market sentiment. This pattern consists of a specific sequence that tells the story of waning buyer momentum and increasing seller dominance:
1. First candle: A long bullish candle that continues the existing uptrend, showing strong buying pressure and confirming buyer confidence.
2. Second candle: A small-bodied candle, often a doji or spinning top, that represents indecision or slowdown in the market. This candle typically opens with a gap up from the previous close, reflecting initial optimism that quickly fades.
3. Third candle: A large bearish candle that opens below the second candle and closes deep into the body of the first bullish candle. This final bearish candle confirms the reversal, demonstrating that sellers have decisively taken control.
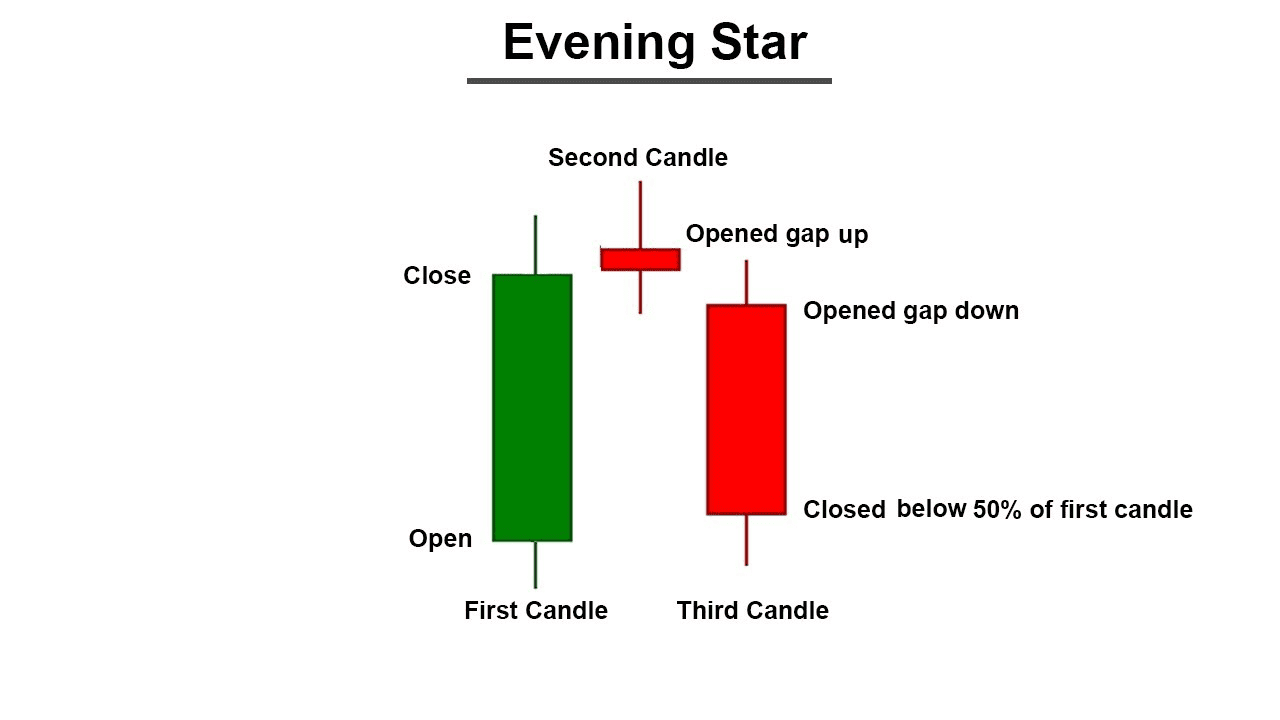
When the evening star pattern forms altogether, it suggests that the market has reached a potential turning point, with bears overpowering bulls after a sustained advance.
How to Spot the Evening Star Candlestick on a Price Chart
Identifying an Evening Star pattern on a cryptocurrency price chart requires attention to specific visual cues:
1. Look for context: the pattern must appear at the end of a clear uptrend to have reversal significance.
2. Identify the sequence: first a green or white bullish candle, followed by a small-bodied second candle with minimal overlap with the first, concluding with a red or black bearish candle.
3. Check the proportions: the first and third candles should have substantial bodies, while the middle candle should be notably smaller.
4. Confirm the penetration: the third candle should close well into the body of the first candle, ideally below its midpoint.
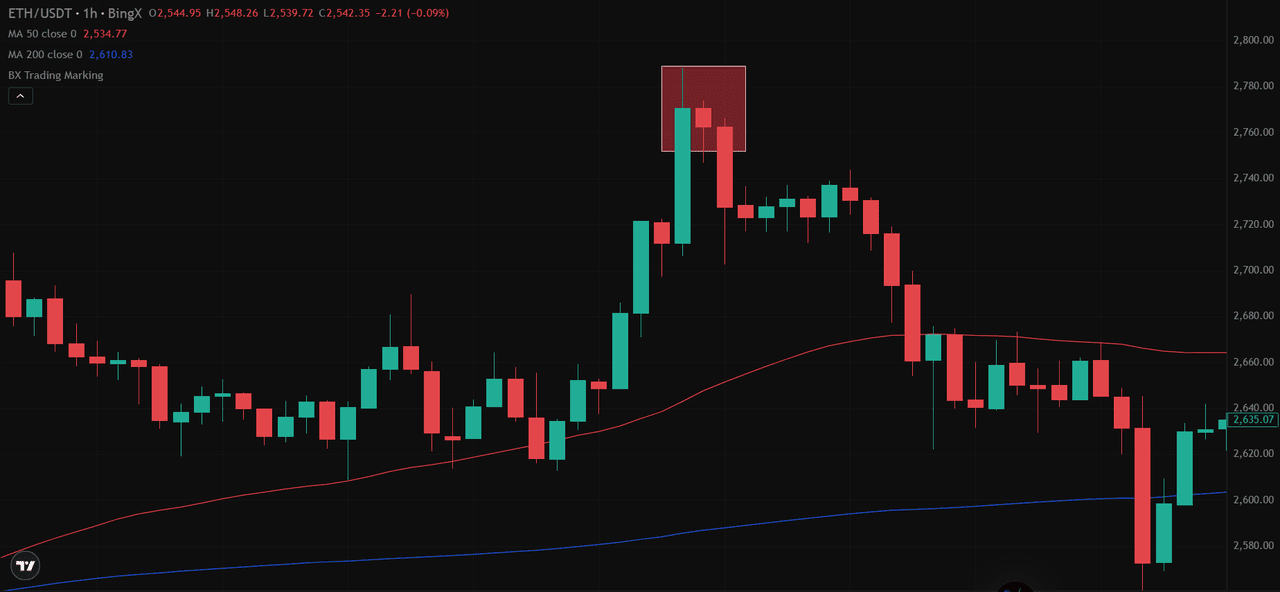 Source: ETH/USD Trading Chart on BingX
It's essential to distinguish the Evening Star from similar patterns, such as the shooting star, which is a single-candle pattern, or the bearish engulfing pattern, which is a two-candle formation. Unlike the Morning Star pattern, which signals bullish reversals at the end of downtrends, the Evening Star indicates potential bearish turns after uptrends.
False signals are standard in sideways markets, so confirm the pattern appears after a clear directional move upward.
How Reliable Is the Evening Star Pattern in Trading Crypto Markets?
The Evening Star pattern's reliability in cryptocurrency markets varies significantly depending on market conditions and accompanying factors. While research suggests a success rate of approximately 65-70% in traditional markets, crypto's heightened volatility can both enhance and diminish its effectiveness.
Key reliability factors include:
• Volume confirmation: An Evening Star pattern becomes significantly more reliable when the third candle, which is bearish, forms with a noticeable increase in trading volume. This volume spike reflects strong participation from sellers and confirms that bearish momentum is building, rather than the move being a short-term correction.
• Market context: The pattern's location within the broader market structure plays a critical role. Evening Stars that appear near key resistance zones or after a sustained bullish rally are more likely to signal a meaningful reversal. In these scenarios, the pattern suggests that buying pressure is fading and that a shift in trend may be underway.
• Timeframe importance: The timeframe on which the pattern forms greatly affects its reliability. Evening Stars observed on daily or weekly charts tend to produce more accurate signals, as they filter out short-term market noise. In contrast, those seen on intraday charts, such as 15-minute or hourly intervals, are often less dependable due to higher volatility and false breakouts.
• Market structure: The prevailing market structure also matters. When the market is trending strongly, Evening Stars have a better chance of predicting a valid reversal. However, during sideways or range-bound conditions, the pattern’s effectiveness diminishes. In such environments, price action lacks direction, and candlestick formations are more prone to failure.
Crypto traders should approach this pattern with greater caution than traditional market participants, as the 24/7 nature of crypto trading and higher volatility can create misleading formations that resemble true Evening Stars.
How to Use the Evening Star in Your Crypto Trading Strategy
The Evening Star candlestick pattern is a powerful bearish reversal signal that often marks the end of an uptrend. It's especially useful in crypto trading when paired with structured strategy and confirmation tools. While the pattern can appear on any timeframe, it tends to be more reliable on longer intervals, such as the 4-hour or daily charts, where price action is less prone to noise.
For intraday trading, additional indicators such as the Relative Strength Index (RSI) or the Moving Average Convergence/Divergence (MACD) are crucial for validating the signal and avoiding false entries.
1. Entry Strategy: Traders usually enter a short position once the third candle in the pattern closes. This candle is typically a strong red candlestick that confirms a shift in momentum. In fast markets, using a direct market order allows for quick execution. For a more precise approach, some traders prefer setting a limit order slightly below the closing price of the third candle.
2. Stop-Loss Placement: To manage risk, the stop-loss should be placed just above the highest point of the middle candle in the pattern. This helps protect against false signals or price spikes. A more cautious option is to place the stop above the highest level of the entire pattern to create more breathing room for the trade.
3. Profit Targets: Profit-taking can follow key technical levels. The first target is often set near the most recent support zone or around the 38.2 percent Fibonacci retracement of the previous rally. If the downward move continues, the next target may be the 61.8 percent level. A final target could reach the full distance of the previous uptrend, although this depends on overall market momentum.
4. Risk Management: A strong trading plan includes clear limits on how much capital to risk. It is wise to limit each trade to no more than one to two percent of your total trading account. Some traders also prefer to scale out gradually, securing partial profits at each target while allowing the rest of the trade to run. Adjust your exposure based on how strong the pattern is and whether other indicators support the signal.
How to Use Technical Indicators to Confirm an Evening Star Pattern
To enhance the reliability of an Evening Star signal, savvy crypto traders combine it with confirming technical indicators:
1. Relative Strength Index (RSI): Look for overbought conditions (RSI > 70) during the pattern formation or bearish divergence where price makes a new high but RSI doesn't.
2. MACD (Moving Average Convergence Divergence) Confirm with a bearish crossover occurring simultaneously with the pattern completion.
3. Volume Analysis: An increase in volume during the third bearish candle strengthens the reversal signal.
4. Fibonacci Retracement Levels: Evening Stars forming at key Fibonacci resistance levels (61.8% or 78.6%) carry additional significance.
This confluence approach, where multiple technical signals align, significantly improves the pattern's predictive power. When an Evening Star appears alongside bearish momentum indicators and key resistance levels, the probability of a successful bearish reversal increases substantially.
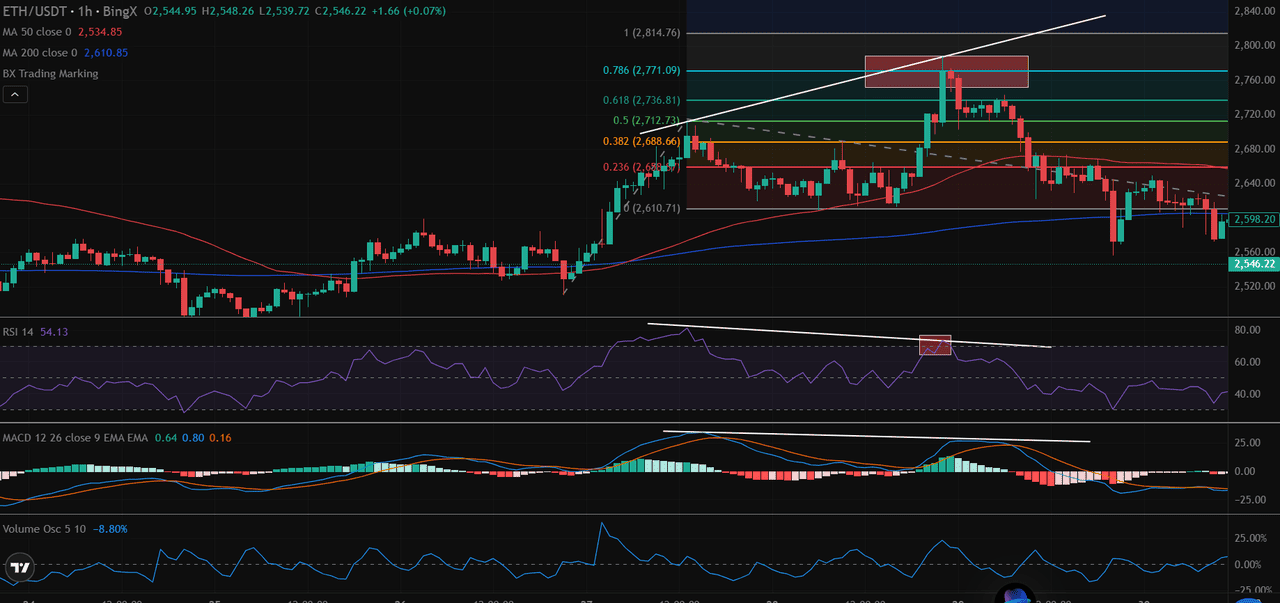 Source: ETH/USD Trading Chart on BingX
On the hourly ETH/USDT chart, price peaked at $2,814.76 before sharply reversing, an ideal setup for bearish confirmation. The RSI climbed to around 78 at this peak, then slipped even as the price attempted a marginal new high, signaling clear bearish divergence.
Simultaneously, the MACD histogram contracted, and the MACD line crossed below its signal line, indicating a weakening of upward momentum. At the same time, volume surged, confirming that selling pressure intensified as the reversal formed near the resistance zone.
Additionally, this reversal occurred just above the 78.6% Fibonacci retracement level, around $2,771, reinforcing the significance of this resistance area. Taken together, overbought RSI divergence, bearish MACD crossover, elevated volume, and alignment with a key Fibonacci level combine to strengthen the signal and increase the probability of a valid trend reversal.
Final Thoughts: Should You Use Evening Star Pattern Alone?
The Evening Star is most effective in trending markets, especially after a clear upward move. It works best on longer timeframes like the daily or weekly chart, where patterns tend to be more reliable. During sideways or ranging markets, its signals are less trustworthy due to inconsistent price action.
This candlestick formation should be part of a broader trading plan that includes support and resistance analysis, multiple timeframe review, and confirmation through momentum indicators. Used wisely, the Evening Star helps traders spot turning points early, manage risk properly, and enter short positions with greater confidence.
In summary, traders should look for this pattern at the end of strong rallies, confirm it with volume and indicators, and use it in combination with solid risk management practices. When all the conditions align, the Evening Star becomes a powerful tool in any crypto trader's arsenal.
Related Reading
5. Simple Moving Average(SMA) vs Exponential Moving Average(EMA) in Crypto Trading: Differences to Know
FAQs on Evening Star Candlestick Patterns
1. Is the evening star pattern always bearish?
Yes, the Evening Star is exclusively a bearish reversal pattern. Its counterpart, the Morning Star pattern, serves as the bullish reversal equivalent.
2. How is it different from the morning star pattern?
While both are three-candle patterns, the Morning Star forms at the bottom of a downtrend and signals a potential bullish reversal, whereas the Evening Star appears at the top of an uptrend and indicates a potential bearish reversal.
3. Can I use it for intraday crypto trading?
Yes, but with caution. The pattern is more reliable on longer timeframes (4-hour, daily). When using it on shorter charts, additional confirmation indicators become essential to filter out false signals caused by intraday volatility.
4. Does the color of the middle candle matter?
The middle candle's color is less important than its size. Whether bullish or bearish, what matters most is that it shows indecision through its small body relative to the surrounding candles.