Chart patterns play a crucial role in technical analysis, providing traders with a structured approach to anticipate price behavior based on historical trends. Among these, triangle formations are widely followed for their ability to signal breakouts during periods of consolidation. The descending triangle pattern is particularly significant in bearish markets, as it indicates increasing selling pressure against a horizontal support level.
While not every descending triangle leads to a breakdown, it remains one of the more commonly used bearish continuation patterns across traditional and crypto markets. Traders watch for the pattern to form during downtrends, using it to time short positions or gauge weakening
bullish momentum. The setup becomes more reliable when supported by volume analysis, moving averages, and confirmation from broader technical or fundamental signals.
Key insights:
• Historical data shows descending triangles have a higher tendency to break down on the bearish side
• The pattern offers a clear framework for managing short positions and stop-loss placement
• It becomes more reliable when combined with technical indicators and market context
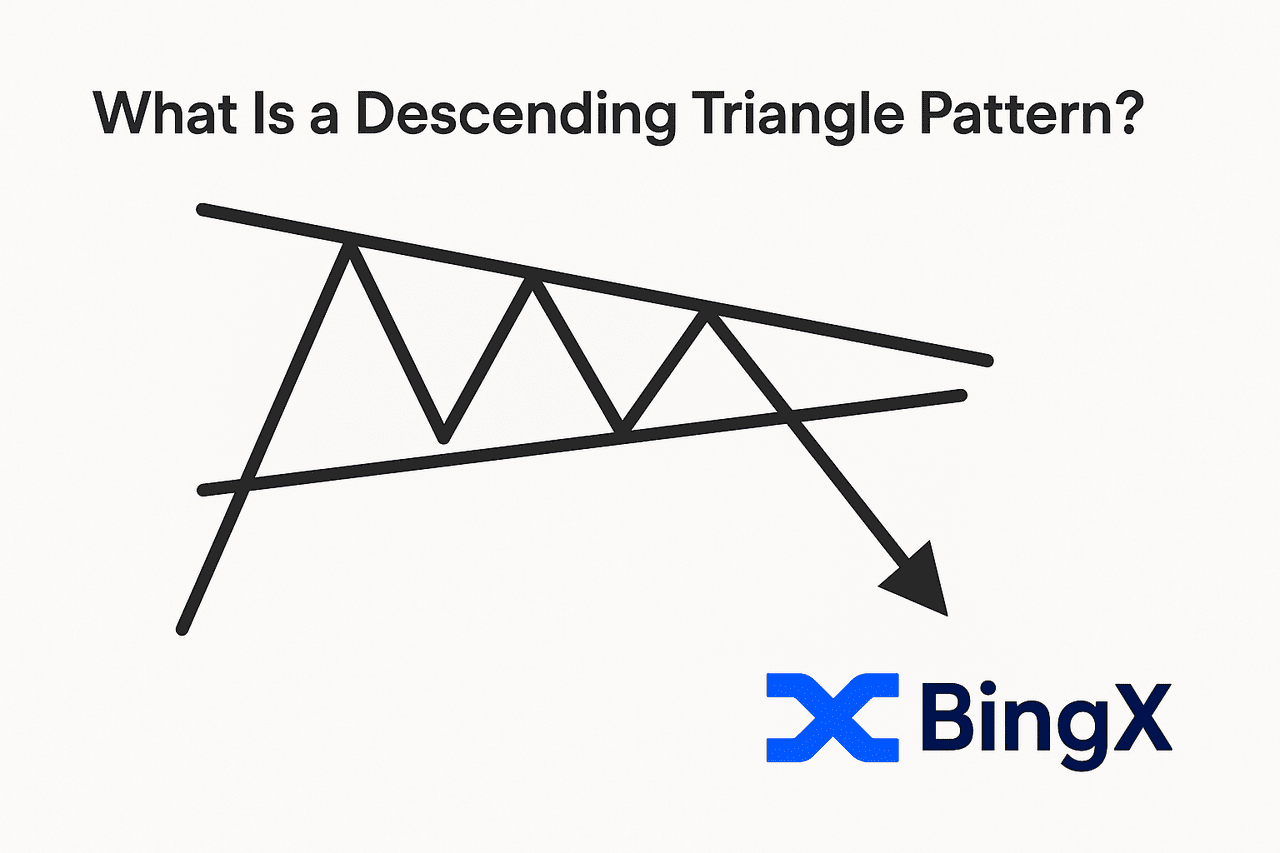
What Is a Descending Triangle Pattern?
The descending triangle is a bearish continuation pattern that forms during market consolidation in a downtrend. It signals that sellers are gradually gaining control while buyers struggle to defend a horizontal support level.
This pattern is shaped by two trend lines:
• A flat support line at the bottom
• A descending upper trendline connecting a series of lower highs
As price tightens between these lines, it reflects growing selling pressure. Buyers continue to step in at the same support level, but each bounce loses strength as sellers push the highs lower. This dynamic creates tension within the pattern, often culminating in a breakdown once the support line is breached with rising volume.
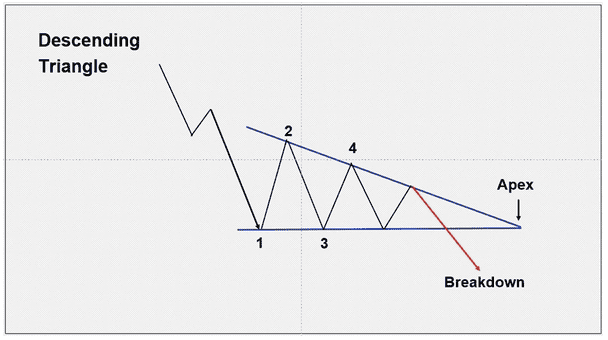
To confirm a valid descending triangle, traders typically look for at least four touchpoints, two on the descending resistance line and two on the horizontal support. This structure helps define the triangle and validates its integrity.
When the price breaks below support, it often triggers a continuation of the existing bearish trend. Traders use this signal to initiate short positions, with price targets often estimated by measuring the height of the triangle and subtracting it from the breakout point.
While not every descending triangle leads to a breakdown, it remains one of the most watched bearish patterns in technical analysis, especially when supported by volume indicators and broader market context.
The Nature of a Descending Triangle Pattern: Bearish or Bullish?
Primarily Bearish by Design
The descending triangle is considered a bearish continuation pattern because it reflects a shift in market control from buyers to sellers. Each lower high shows sellers are stepping in earlier, while buyers continue to defend the same support level. This standoff creates a triangular structure, with pressure building until support gives way.
Once the price breaks below the support line, ideally confirmed with a strong close and increased volume, it signals that sellers have taken over. The breakdown often leads to a sharp move lower, in line with the previous trend.
Can It Ever Be Bullish?
In some cases, the descending triangle can act as a reversal pattern, forming during an uptrend before breaking downward. These instances are rare and generally less reliable. When they do happen, it usually indicates a sudden shift in sentiment or an external catalyst that causes selling pressure to outweigh buying strength.
While descending triangles can technically break in either direction, they are most effective and reliable when confirming a bearish continuation. Traders focus on them within downtrends for clearer signals and higher-probability setups.
How to Identify the Descending Triangle Chart Pattern
Recognizing a descending triangle pattern starts with spotting the right conditions in a downtrend. The pattern often develops when the market takes a breather after a sharp move lower, but underlying bearish pressure remains. During this phase, price action begins to contract, forming a recognizable triangular structure that reflects increasing seller dominance.
The most telling feature of the descending triangle is a flat support level that repeatedly halts downward moves. At the same time, the highs become progressively lower, creating a sloped resistance line above. This setup signals that buyers are losing momentum while sellers are gaining ground.
How to validate a descending triangle chart pattern:
• Identify a clear downtrend leading into consolidation
• Draw a descending resistance line connecting at least two lower highs
• Mark a horizontal support level that has been tested multiple times without a breakdown
• Confirm at least four total touchpoints, two along resistance, two along support
Once these conditions are met, traders watch closely for a breakdown below support, typically confirmed by strong volume and a decisive candle close.
Source:
BTC/USD Trading Chart on BingX
BTC/USDT Example
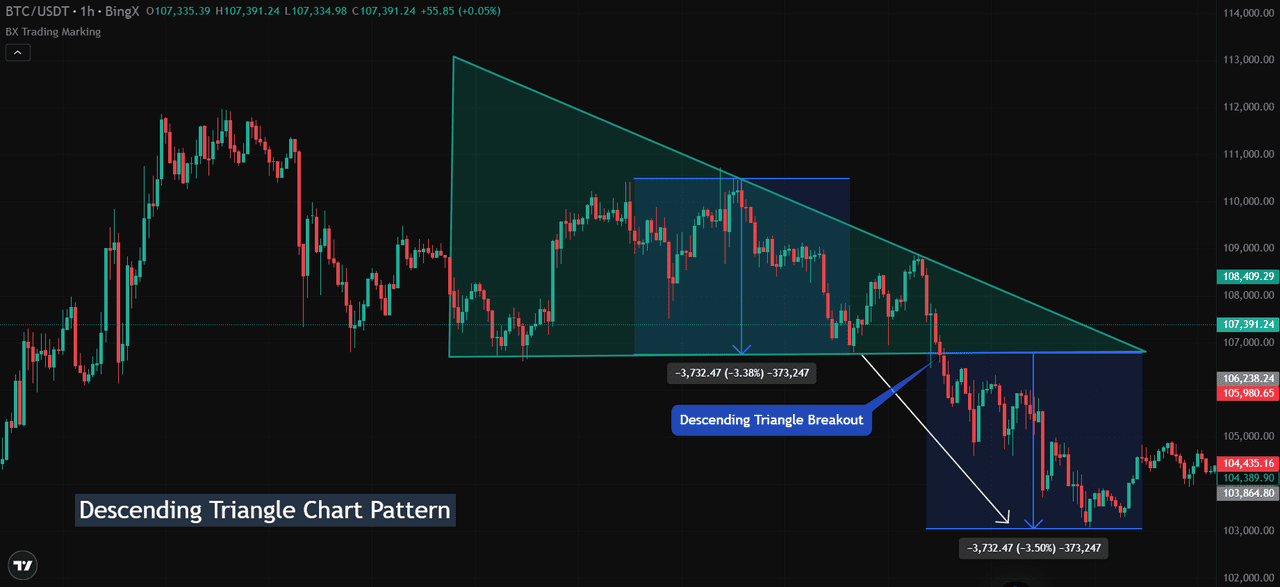
In the 1-hour chart of BTC/USDT on BingX, a descending triangle formed between the $108,400 and $107,000 levels.
Bitcoin repeatedly failed to break above lower highs while support around $107,000 held steady. After several tests, price broke below this support line, triggering a descending triangle breakout.
• Breakout level: Around $107,000
• Measured move: $3,732 drop from the triangle's height
• Price target hit: Near $103,300, marking a 3.5% decline
After the breakdown, price briefly retested the former support (now resistance), validating the setup before continuing its descent. This real-world chart demonstrates how the descending triangle can offer a clean and actionable trade signal, especially when it aligns with the broader bearish trend.
How to Execute a Trade Using the Descending Triangle Chart Pattern
Trading a descending triangle setup can offer high-probability opportunities when approached with discipline and clear rules. Once the pattern is confirmed with a breakdown below support, traders can enter short positions with defined risk and target levels.
Source:
BTC/USD Trading Chart on BingX
Let’s walk through the process using a real-world Bitcoin chart on BingX.
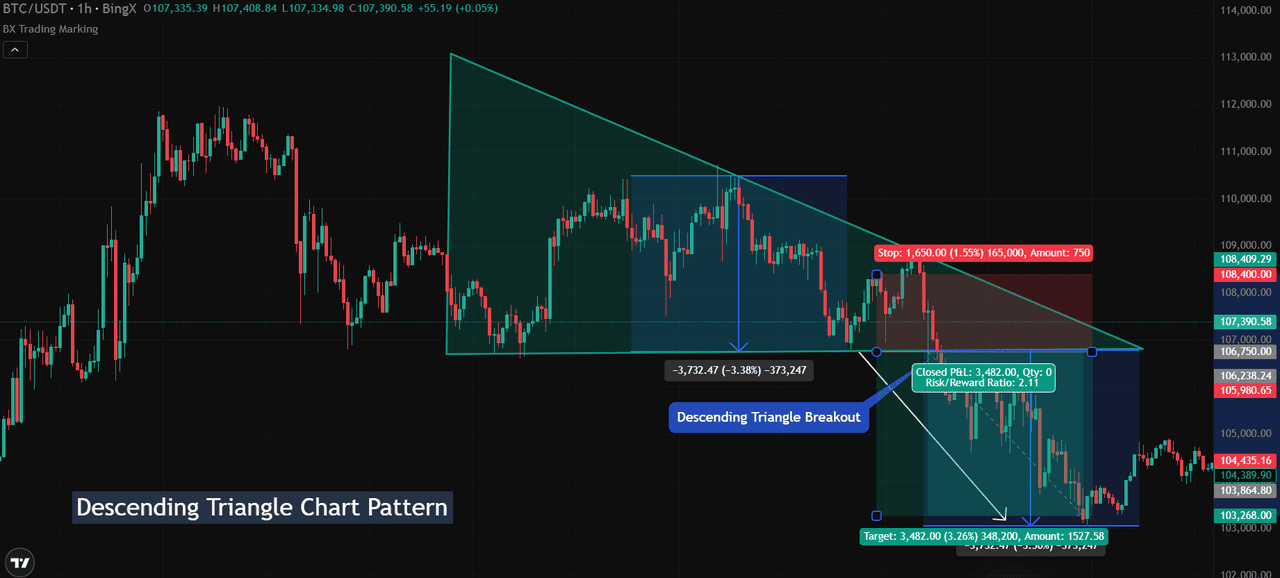
1. Identifying the Pattern: Start by confirming the descending triangle during a downtrend. In the BTC/USDT 1-hour chart, Bitcoin repeatedly tested the $107,000 support while forming lower highs, clearly defining the descending triangle structure.
2. Trade Entry: Breakdown Confirmation: Enter the trade when the price breaks below the horizontal support line. In this example, the breakdown occurred just below $107,000, supported by a spike in volume that confirmed bearish momentum.
3. Stop-Loss Placement: Place your stop-loss slightly above the most recent lower high or the descending trendline. For this trade, a reasonable stop could be set near $108,400, which is where the upper resistance line was last touched before the breakdown.
4. Setting the Profit Target: To calculate the profit target, measure the height of the triangle from the highest point of the pattern to the flat support base, then subtract that from the breakdown level.
• Height of the triangle: $3,732
• Breakdown level: $107,000
• Target: $107,000 - $3,732 = $103,268
This sets a clear downside target based on the pattern’s structure. In the actual price action, Bitcoin reached nearly $103,300, effectively completing the move.
Watch for False Breakouts in Descending Triangles
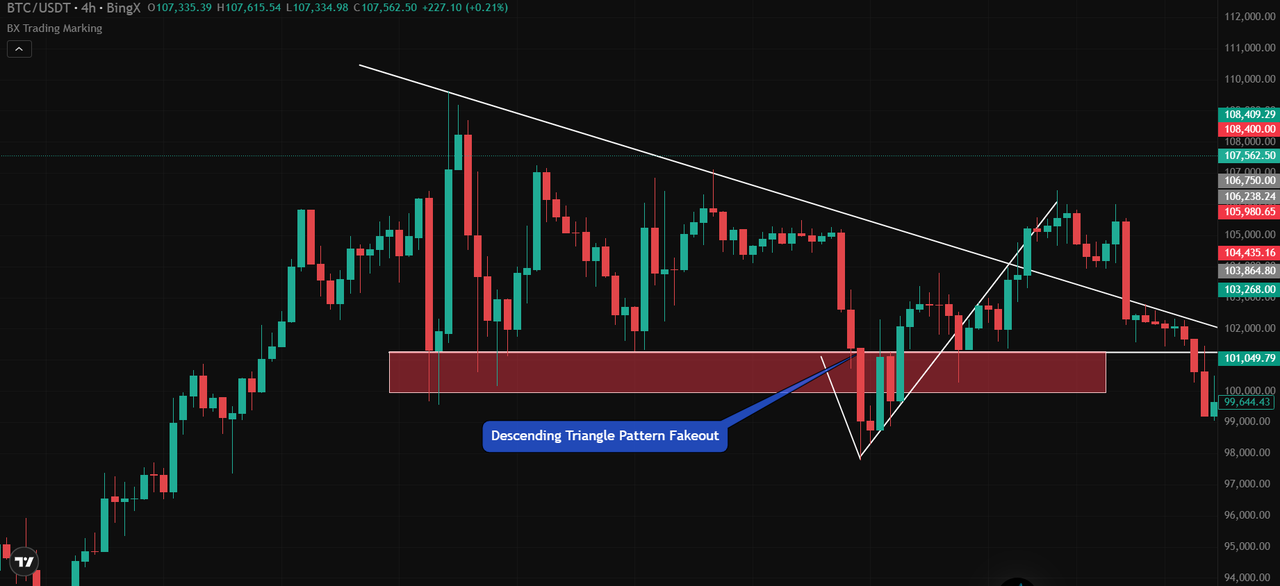
Descending triangles do not always lead to clean breakdowns. In some cases, price dips below the support line only to reverse sharply. This is known as a false breakout or fakeout, a move that often traps early short-sellers and triggers stop-losses before the market rebounds.
Fakeouts are more likely during low-volume sessions or sudden shifts in sentiment. Price briefly breaks below support, attracting bearish trades, but fails to hold and quickly reclaims the zone. These reversals can invalidate the setup and result in unexpected losses for unconfirmed entries.
Source:
BTC/USD Trading Chart on BingX
BTC/USDT Example: Fakeout Scenario
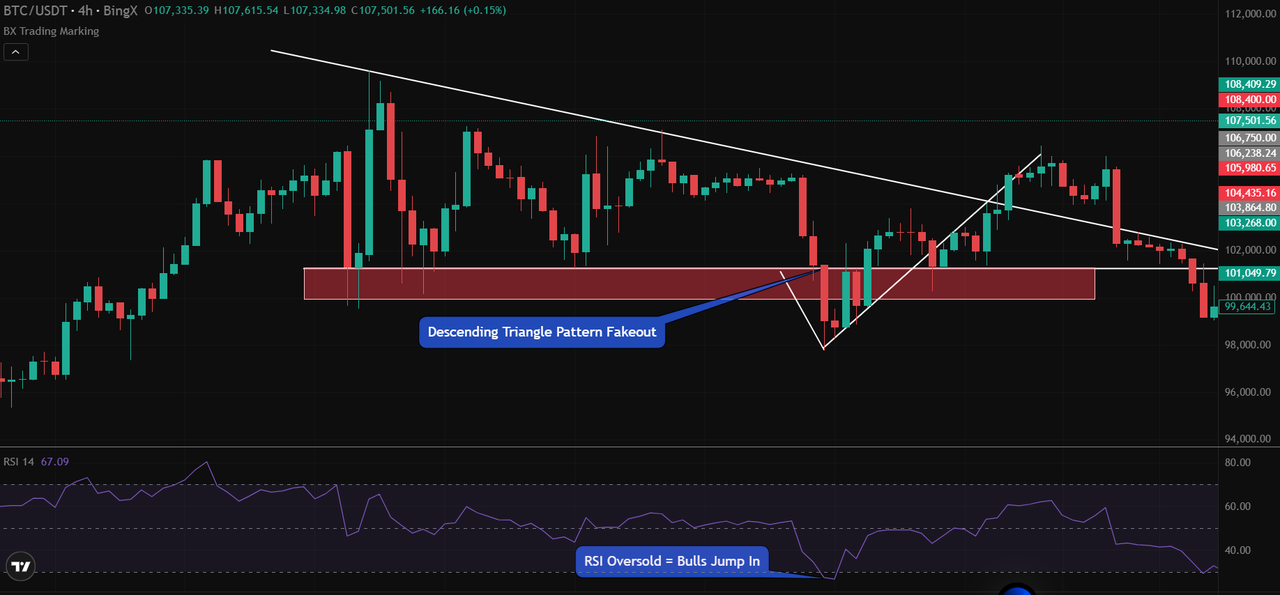
In the 4-hour chart on BingX, Bitcoin fell below the key support near $101,000, appearing to confirm a descending triangle breakdown. However, the move quickly reversed, and price climbed back to $105,000, erasing the breakout. Traders who entered without confirmation were left on the wrong side of the market.
Source:
BTC/USD Trading Chart on BingX
BTC/USDT Example: RSI as a Warning Signal
What made this fakeout more obvious was confirmation from the
Relative Strength Index (RSI). At the time of the breakdown, RSI dropped into oversold territory, typically below 30. This signaled that the asset was stretched on the downside and due for a bounce. Shortly after, the bulls stepped in, pushing the price back above support and launching a short-term rally.
How to avoid false breakouts:
• Wait for a decisive candle close below support, ideally with volume
• Use RSI or Moving Average Convergence Divergence to confirm momentum
• Watch for a retest of broken support turning into resistance
• Adjust position size and apply tighter risk management near breakout zones
Preparing for fakeouts helps traders stay patient, avoid emotional entries, and improve long-term consistency.
Pros and Cons of the Descending Triangle Pattern
Like any chart pattern, the descending triangle comes with both advantages and limitations. Understanding both can help traders make more confident and informed decisions when planning entries, exits, and risk management.
Advantages
1. Clear trade structure: The pattern provides well-defined entry, stop-loss, and target levels, making it easier to plan trades with discipline.
2. Target estimation made simple: Measuring the height of the triangle allows traders to project realistic profit targets after a confirmed breakout.
3. Ideal in bearish markets: Descending triangles work especially well during established downtrends, offering high-probability setups for short positions.
4. Predictive value: The structure reflects a shift in market pressure and can offer early signals of trend continuation.
Limitations
1. Subjectivity in drawing trendlines: Minor variations in price action can lead to inconsistent interpretations among traders.
2. False breakouts are common: Price may briefly dip below support before reversing. Entering without confirmation can result in losses.
3. Trend-dependency: The pattern is less effective in sideways or choppy markets where direction is unclear.
4. Skill takes time to develop: Properly identifying descending triangles requires experience and continuous observation.
How to Mitigate the Drawbacks
• Combine with other tools: Use moving averages, volume analysis, or momentum indicators to confirm the pattern before entering a trade.
• Practice with real charts: The more you study historical examples, the easier it becomes to recognize valid setups and avoid traps.
Understanding both the strengths and weaknesses of the descending triangle pattern and implementing these mitigation strategies can contribute to more informed and successful trading decisions.
Comparing Descending Triangles, Falling Wedges, and Ascending Triangles
Understanding the distinctions between similar chart patterns is key to making informed trading decisions. Although descending triangles, falling wedges, and ascending triangles may appear structurally similar at first glance, each carries different market implications and trade opportunities.
Descending Triangle vs. Falling Wedge
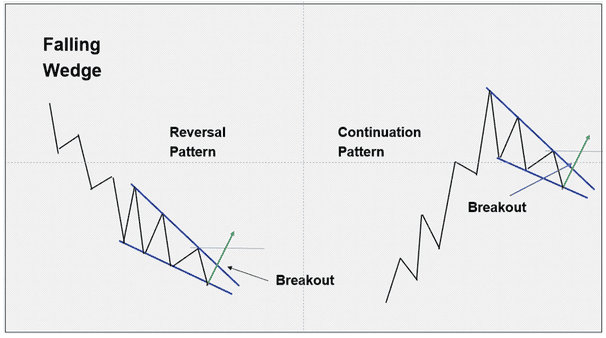
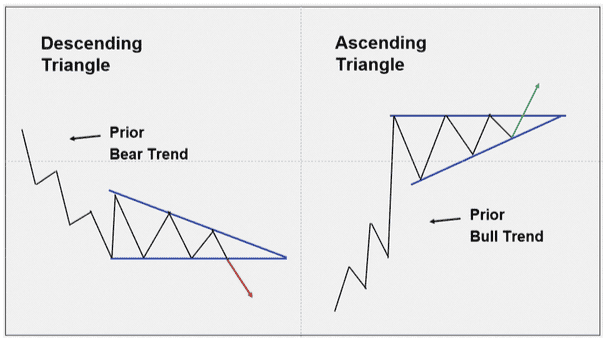
The descending triangle is a bearish continuation pattern. It forms when price consolidates between a flat support line and a descending resistance line. This setup reflects strong selling pressure, with each lower high showing that sellers are dominating. A breakdown below the support line often leads to further price declines.
In contrast, the falling wedge is a bullish pattern. It is formed by two converging trendlines that both slope downward. While it may occur during a downtrend, the breakout is typically to the upside.
This makes it a versatile pattern that can act as a reversal in a downtrend or a continuation in an uptrend. A confirmed breakout is generally signaled when price closes above the upper resistance line.
Descending Triangle vs. Ascending Triangle
While the descending triangle signals bearish continuation, the ascending triangle reflects bullish intent. It forms during uptrends and features a rising support line and a flat resistance level. Buyers consistently step in at higher lows, building pressure against a resistance zone. Once broken, the move typically continues upward.
In essence:
• Descending triangle forms in downtrends and breaks lower
• Ascending triangle forms in uptrends and breaks higher
Conclusion
The descending triangle pattern is a go-to tool for traders looking to anticipate bearish breakouts during consolidation. With its clear structure and strong predictive value, it helps streamline trade setups in trending markets. To apply this strategy with precision, explore real-time charts and indicators on the BingX platform, built for both new and experienced traders ready to trade with confidence.
Related Reading
FAQs on Descending Triangle Patterns
1. Is the descending triangle pattern always bearish?
No, while it is primarily a bearish continuation pattern, in rare cases it can signal a reversal during an uptrend. However, its most reliable use is within a downtrend.
2. How do you confirm a descending triangle breakout?
Confirmation typically comes with a strong candle close below the support line, supported by high volume or momentum indicators like RSI or
MACD.
3. What is the target price after a descending triangle breakout?
The target is often calculated by measuring the height of the triangle and subtracting it from the breakdown point. This gives an approximate price objective.
4. Can false breakouts happen with the descending triangle chart pattern?
Yes, especially in low-volume markets. Waiting for confirmation and using tools like RSI can help avoid false signals.
5. Is the descending triangle suitable for beginner traders?
Yes, it’s one of the more visually clear patterns and can be an excellent starting point for traders learning to analyze market structure and plan entries.
 Source: BTC/USD Trading Chart on BingX
 Source: BTC/USD Trading Chart on BingX
 Source: BTC/USD Trading Chart on BingX
 Source: BTC/USD Trading Chart on BingX