The symmetrical triangle pattern is one of the most recognized chart patterns in technical analysis, known for its reliability in signaling breakouts. Formed by two converging trend lines, this pattern reflects market consolidation and trader indecision before a potential price movement.
Alongside the ascending (bullish) and descending triangle patterns (bearish), the symmetrical triangle stands out for its versatility. It can act as a continuation pattern or a reversal, depending on the breakout direction.
Typically forming over several weeks, the pattern narrows as trend lines converge, leading to a breakout with strong momentum. When this formation occurs within an uptrend, it often signals a bullish continuation.
In this guide, you’ll learn how to identify the symmetrical triangle formation, compare it to other triangle patterns, and use it to set price targets, manage risk, and make more informed trading decisions.
What Is a Symmetrical Triangle Pattern?
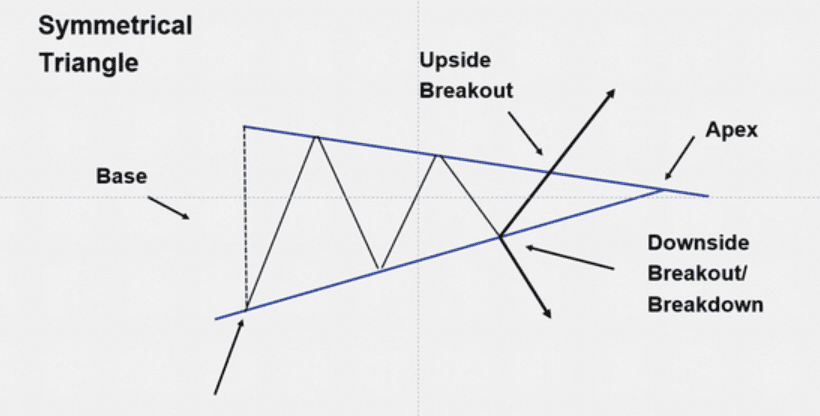
The symmetrical triangle pattern is a common chart pattern in technical analysis, formed by two converging trendlines that converge to create a triangle shape. A descending upper trendline that connects lower highs and an ascending lower trendline that connects higher lows. These converging trendlines reflect a market in consolidation, where buyers and sellers temporarily reach equilibrium.
As the triangle formation narrows, price movements become more compressed, leading to a drop in market volatility. This tightening range often resembles a coiled spring, quiet at first, but primed for a sharp price breakout in either direction.
Key characteristics of the symmetrical triangle include:
• Two trendlines sloping toward each other, meeting at an apex
• A minimum of four touches (two on each trendline)
• Decreasing trading volume during formation
• A breakout is often accompanied by a volume surge and strong price movement
Although it’s considered a neutral continuation pattern, the symmetrical triangle often takes on the direction of the prevailing trend - bullish in an uptrend, bearish in a downtrend. The breakout point is the price level at which the triangle is breached, confirming the pattern and setting the stage for a potential target price move.
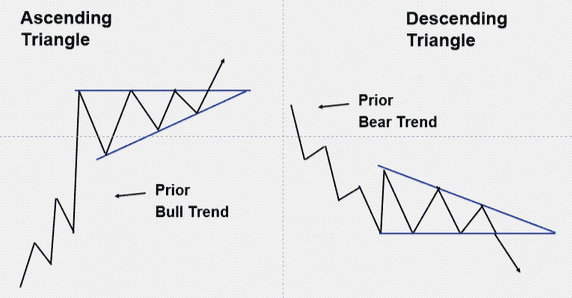
In contrast:
• An ascending triangle includes a horizontal upper line and a rising lower trend line, showing increasing buying pressure.
• A descending triangle features a horizontal support line with a descending upper trend line, indicating aggressive selling momentum.
What Is a Bullish Symmetrical Triangle Pattern?
A bullish symmetrical triangle forms during an uptrend and typically signals a possible continuation of the bullish trend. The pattern begins once the market prints at least two lower highs and two higher lows, establishing two converging trendlines. As the pattern develops, the price range contracts, indicating temporary indecision.
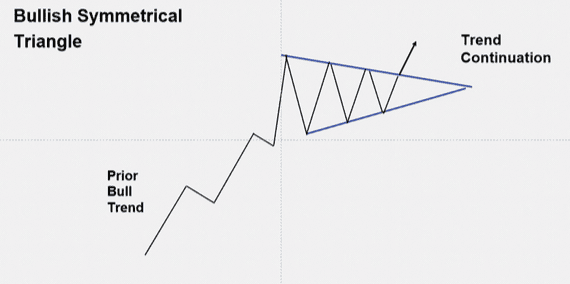
The breakout point occurs when the price pushes above the upper trendline. For confirmation, traders often wait for a daily close above the trendline, ideally supported by rising trading volume or a clear candlestick pattern. These additional signals help validate the breakout direction and reduce the risk of a false breakout.
Until a confirmed breakout occurs, the setup remains a potential symmetrical triangle, and traders should remain cautious, as price behavior may shift or develop into a different chart structure.
What Is a Bearish Symmetrical Triangle Pattern?
A bearish symmetrical triangle appears within a downtrend and often suggests that the market may continue moving lower. As with its bullish counterpart, this pattern is defined by two converging trendlines, but in this case, the bias favors the bearish breakout.
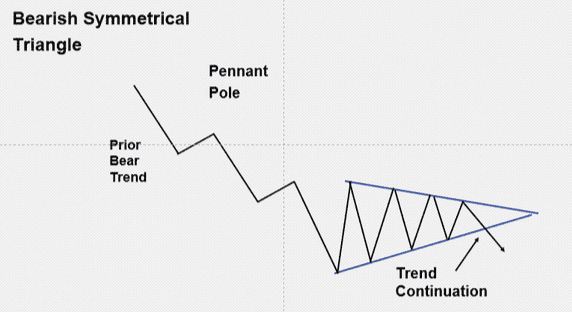
The pattern completes when the price breaks below the lower trendline and closes beneath it. Traders typically look for an increase in trading volume or confirmation from other technical indicators, such as the Relative Strength Index (RSI) or the Moving Average Convergence Divergence (MACD), to validate the bearish breakout. This confirmation is essential for filtering out false breakouts and identifying genuine downside momentum in the market.
The breakout direction aligns with the existing trend, and once confirmed, the pattern often leads to a measured move equal to the triangle’s widest range projected from the breakout.
How to Identify the Symmetrical Triangle Chart Pattern
To effectively recognize a symmetrical triangle chart pattern, the first step is identifying an existing trend, either bullish or bearish. From there, traders look for a period of consolidation where price forms lower highs and higher lows, creating two converging trendlines that slope toward each other.
This narrowing price range reflects market indecision, often leading to a breakout in the direction of the prevailing trend. These patterns are typically confirmed once the price closes beyond one of the trendlines with rising volume or support from technical indicators.
Bearish Symmetrical Triangle Continuation Pattern Example
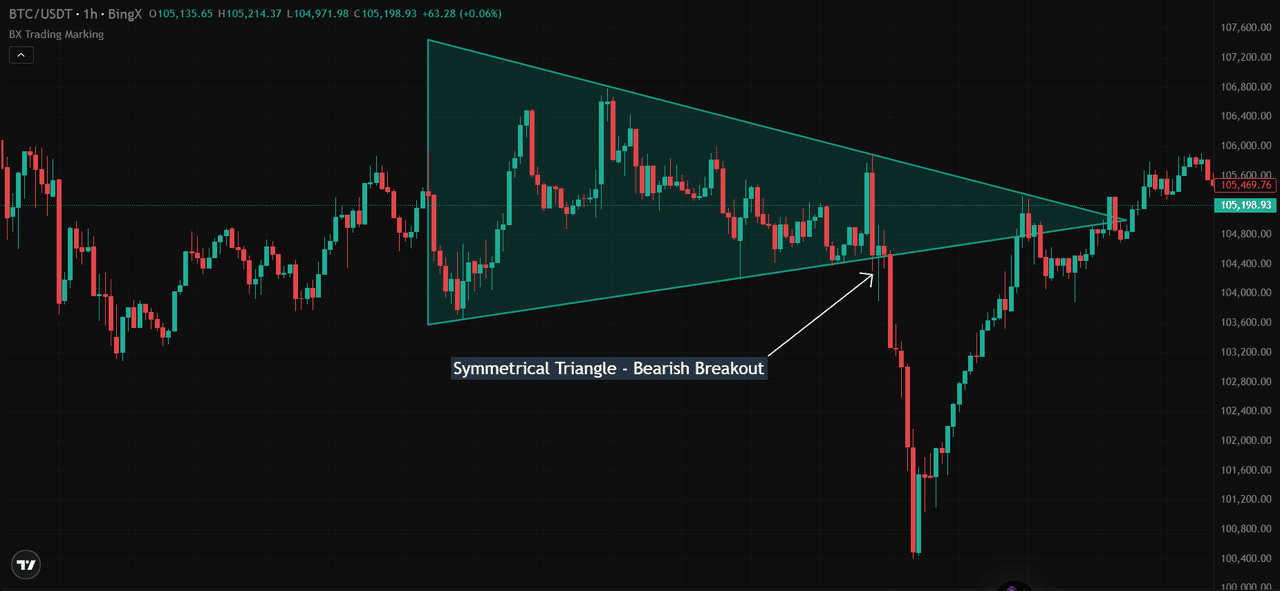
In the chart below, the BTC/USDT 1-hour timeframe shows a bearish symmetrical triangle forming during a downtrend. The price action compresses between two converging trendlines, signaling market hesitation.
Once the price breaks below the lower trendline, it confirms a bearish breakout, continuing the downward momentum.
 Source: BTC/USD Trading Chart on BingX
For instance, the upper trendline connects lower highs near $105,500, while the lower trendline supports higher lows around $105,200.
As the triangle nears its apex, BTC/USDT breaks below the lower trendline, triggering a bearish breakout around $105,150. The move is followed by a sharp decline toward $101,200, confirming the continuation of the bearish trend.
An increase in trading volume at the breakout validates the move and provides confidence for traders looking to short.
Bullish Symmetrical Triangle Continuation Pattern Example
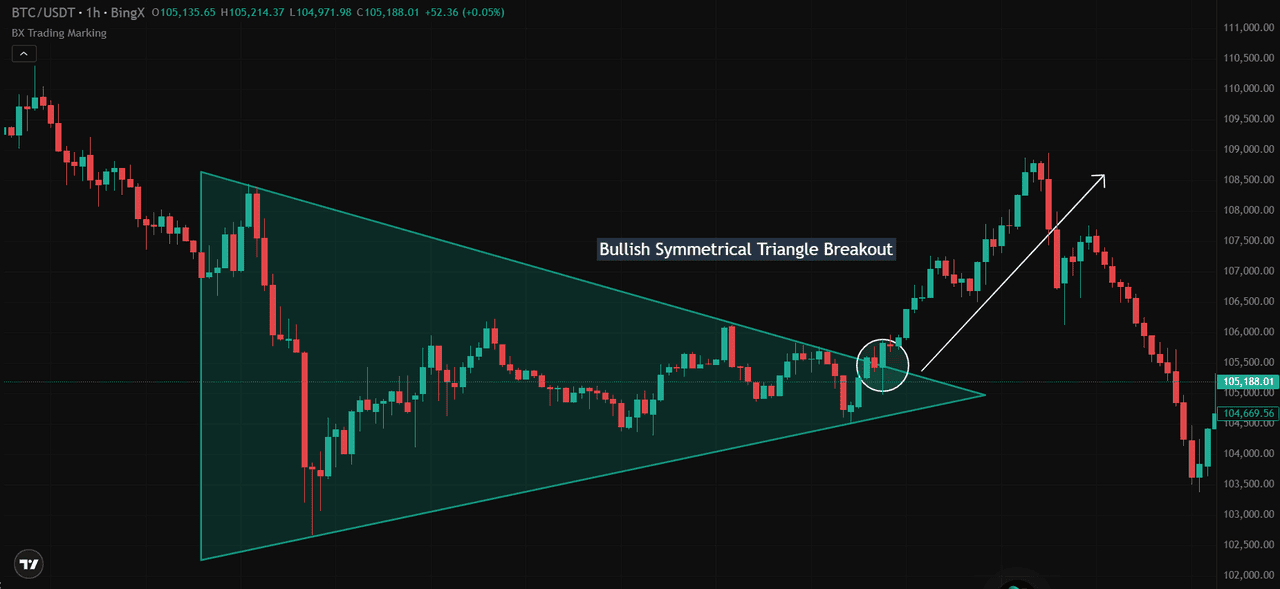
This second example on BTC/USDT (1-hour chart) highlights a bullish symmetrical triangle. Formed within an ongoing uptrend, the pattern consolidates price within two sloping trendlines. As the apex approaches, the price breaks above the upper trendline, confirming a bullish breakout.
The move is supported by increased trading volume, validating the breakout direction and suggesting trend continuation.
 Source: BTC/USD Trading Chart on BingX
This example (BTC/USDT, 1-hour chart) illustrates a bullish symmetrical triangle forming within an uptrend. The upper trendline caps price near $105,000, while the lower trendline supports higher lows around $104,300.
The breakout occurs as BTC/USDT surges above the $105,000 resistance, closing decisively around $105,800, which confirms the bullish breakout. The price continues climbing to $108,500, hitting a target price derived from the triangle’s height. The breakout is supported by strong volume, reinforcing trend continuation and offering a favorable long setup.
Spotting a Symmetrical Triangle Pattern
An example of a symmetrical triangle can be observed when a crypto trades within a narrowing range for several weeks, with price action repeatedly bouncing between two converging trend lines. As the triangle pattern develops, the distance between the highs and lows decreases, and trading volume typically diminishes, reflecting reduced market volatility.
As the price approaches the apex of the triangle, traders watch closely for a breakout. When the price finally breaks through one of the converging trend lines, accompanied by a surge in trading volume, it confirms the breakout direction.
Traders often use technical indicators such as the relative strength index (RSI) to gauge momentum and validate the breakout. This classic example of a symmetrical triangle demonstrates how the pattern can signal a significant price move and help traders set precise price targets based on the height of the triangle at its widest point.
How to Use the Symmetrical Triangle Pattern in Your Trading Strategy
To trade the symmetrical triangle pattern effectively, it's essential to build a structured strategy based on trend direction, breakout behavior, and clear risk management. This section covers scenarios like bearish continuation and bullish continuation. Each setup includes an entry point, a stop-loss level, and a target price based on the pattern's structure.
The target is calculated using the measured move method. This involves measuring the distance between the highest and lowest points at the start of the triangle and applying that range to the breakout level.
1. Bear Trend Trading Strategy
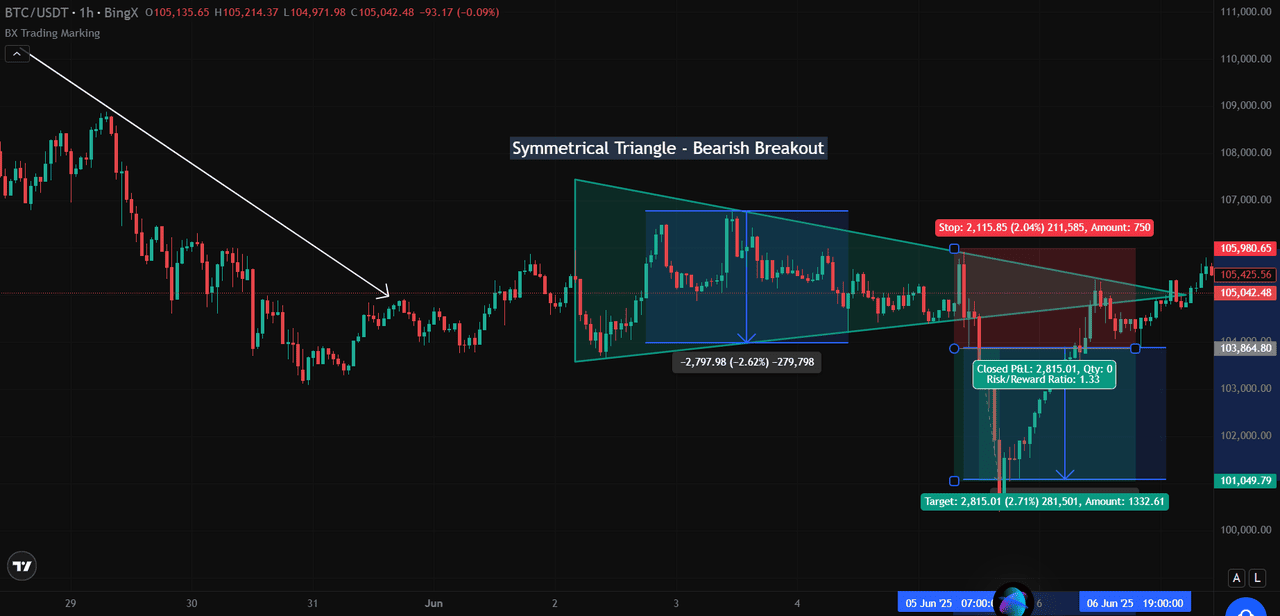
This one-hour Bitcoin chart shows a clear example of a bearish symmetrical triangle forming in the middle of a downtrend. The pattern develops as price action compresses between two converging trendlines, signaling a period of consolidation after a sharp decline.
A breakout occurs when the price moves below the lower trendline near $105,425, triggering the entry. To manage risk, a stop-loss is placed just above the upper boundary of the triangle at $105,980. This protects against a reversal in case the breakout fails.
 Source: BTC/USD Trading Chart on BingX
The target is calculated by measuring the height of the triangle at its widest point, which is around $2,800. This range is subtracted from the breakout level, projecting a target close to $101,050. The move plays out with strong downward momentum, hitting the target area.
This setup offers a solid risk-to-reward ratio of about 1.33 and is supported by rising volume and a clean retest of the breakout zone. It shows how the symmetrical triangle pattern can help traders enter with confidence, protect their capital, and plan realistic profit targets during bearish continuation phases.
2. Bull Trend Trading Strategy
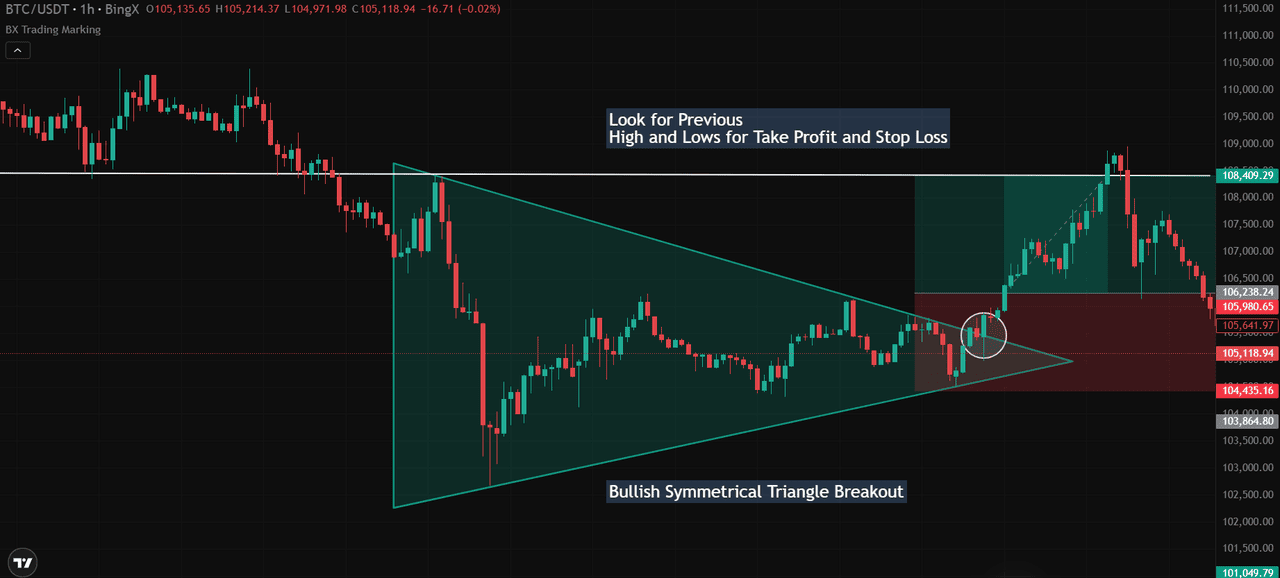
This one-hour chart of BTC/USDT shows a bullish symmetrical triangle forming after a period of downward pressure. As the pattern develops, price action tightens between two converging trendlines, creating a classic consolidation setup ahead of a potential breakout.
The entry is triggered when the price pushes above the upper trendline near $105,641, confirming the breakout. To manage risk, a stop-loss is placed just below the lower trendline at $104,435, giving room for minor pullbacks without invalidating the setup.
 Source: BTC/USD Trading Chart on BingX
For the target, we look at the previous swing high around $108,409. This level acts as a realistic price objective, aligning with the measured move approach and offering a clean take-profit zone.
The breakout unfolds with strong upward momentum, and volume picks up shortly after the breakout candle closes. This trade highlights how bullish symmetrical triangles can offer solid opportunities during trend continuation phases, especially when supported by prior price structure and volume confirmation.
Pros and Cons of the Symmetrical Triangle Pattern
The symmetrical triangle pattern offers traders both advantages and limitations. To make more informed trading decisions, it's important for traders to recognize these aspects and use the pattern in the appropriate context, often in conjunction with other technical analysis tools.
Pros
1. Forecasts Potential Price Movement: The symmetrical triangle helps anticipate future price direction, giving traders a useful tool to gauge market momentum and prepare for breakouts.
2. Clear Entry and Exit Structure: It offers clearly defined levels for entries, stop-loss placement, and profit targets, which can help remove guesswork from the decision-making process.
3. Favorable Risk-to-Reward Setup: Since breakout and invalidation levels are easy to define, the pattern often supports trades with balanced or even favorable risk-to-reward ratios.
4. Aligns with Trend Direction: When used in trending markets, the pattern can act as confirmation of a continuation move, giving traders confidence to follow the dominant trend.
5. Helps Estimate Target Levels: The structure of the triangle allows traders to project price targets based on the height of the pattern, offering a logical objective after a breakout.
Cons
1. False Signals: The pattern can yield false signals, and breakouts do not always translate into sustained price movements. Traders should exercise caution and employ additional analysis to confirm signals.
2. Variability in Pattern Identification: Traders may identify the symmetrical triangle pattern differently, leading to slight variations in its interpretation.
3. Practice Required: Successful identification of the pattern demands practice and experience. Novice traders may struggle to spot it accurately.
4. Choppy Markets: The pattern is less accurate in choppy or range-bound markets, making it important for traders to use it primarily in trending market conditions.
How to Mitigate Limitations of the Symmetrical Triangle Pattern
While the symmetrical triangle pattern can be a valuable tool, it does come with certain challenges. To improve reliability and avoid common pitfalls, traders can apply the following strategies to strengthen their approach and manage risk more effectively.
1. Spot False Breakouts Early: Not every breakout leads to a sustained move. Focus on the quality of the trend leading into the triangle. When the pattern follows a strong trend supported by rising volume and steady momentum, there’s a higher chance of continuation. Use indicators like moving averages to confirm the trend’s strength before entering a trade.
2. Use Multi-Time Frame Analysis: Check for alignment across several time frames. If the pattern shows the same breakout direction on the daily, weekly, and monthly charts, it builds more confidence and reduces the risk of conflicting signals.
3. Practice Through Chart History: Pattern recognition improves with repetition. Review historical charts, draw symmetrical triangles where they appear, and study how price behaved before and after the breakout. Over time, this builds instinct and improves your ability to identify valid patterns.
4. Avoid Sideways or Choppy Conditions: Symmetrical triangles are more reliable in trending markets. In sideways or indecisive conditions, breakouts tend to be weak or fail entirely. Stick to clear trends to increase the pattern’s effectiveness.
How to Avoid Common Mistakes When Trading Symmetrical Triangles
Trading symmetrical triangles effectively requires discipline and a solid plan. One of the most common mistakes is assuming the breakout direction before it actually happens. Since this is a neutral pattern, breakouts can occur in either direction, and guessing early can lead to costly errors.
Another mistake is failing to use a stop-loss. Without proper protection beyond the triangle’s opposite boundary, traders risk being caught in sharp reversals. Over-leveraging adds even more danger, especially if the breakout turns out to be false.
To reduce these risks, wait for confirmation with clear price action and increased volume. Set stop-losses beyond key levels and size positions sensibly to manage volatility. These habits can lead to more consistent results and stronger confidence when using the symmetrical triangle in real-time trading.
Real-World Uses and Final Thoughts on Symmetrical Triangle Patterns
Symmetrical triangle patterns are a widely used tool in technical analysis, helping traders across stocks, forex, and crypto markets identify potential breakouts and forecast price movements. These patterns signal a period of market consolidation, with breakouts, either upward or downward, often indicating the continuation or reversal of a trend.
In practice, traders watch for a breakout to confirm direction. An upward breakout may trigger a long position, while a downward move could prompt a short trade. To reduce the risk of false signals, symmetrical triangles are frequently combined with other indicators like moving averages and the Relative Strength Index (RSI), refining trade entries and exits.
When used correctly and in combination with other tools, symmetrical triangle patterns offer clearly defined entry and exit points, helping traders build more disciplined and profitable strategies in volatile crypto markets.
Despite their reliability, symmetrical triangles are not foolproof. Traders should be aware of limitations such as false breakouts and subjective interpretation. Effectiveness can also vary depending on market conditions.
Related Reading
5. Simple Moving Average(SMA) vs Exponential Moving Average(EMA) in Crypto Trading: Differences to Know
FAQs on Symmetrical Triangle Patterns
1. What is a symmetrical triangle pattern in trading?
A symmetrical triangle is a chart pattern formed by two converging trendlines, one descending from lower highs and the other ascending from higher lows. It signals market consolidation and often precedes a breakout in either direction.
2. Is the symmetrical triangle a continuation or reversal pattern?
It can act as both. In most cases, it behaves as a continuation pattern, following the existing trend. However, in some situations, it may signal a reversal, depending on the breakout direction and volume confirmation.
3. How do you trade a symmetrical triangle pattern?
Traders typically wait for a confirmed breakout beyond the upper or lower trendline, followed by increased volume. Entry is made after the breakout, with stop-loss set outside the opposite side of the triangle and a target based on the triangle's height.
4. What makes a breakout from a symmetrical triangle reliable?
Breakouts are more reliable when accompanied by rising volume and occur in the direction of the prior trend. Confirmation from other indicators like RSI or moving averages can also increase breakout strength.
5. What is the measured move target for a symmetrical triangle?
The measured move is the vertical distance between the highest and lowest points of the triangle. This value is projected from the breakout level to estimate the potential target price.