The Hammer Candlestick Pattern is a bullish reversal indicator commonly used in cryptocurrency trading. It identifies buyers overcoming sellers after a downtrend and helps traders time entries with improved risk management. Learn how to use the Hammer Candlestick Pattern to spot bullish reversals in crypto trading and improve your entry timing after a downtrend.
What Is a Hammer Candlestick Chart Pattern?
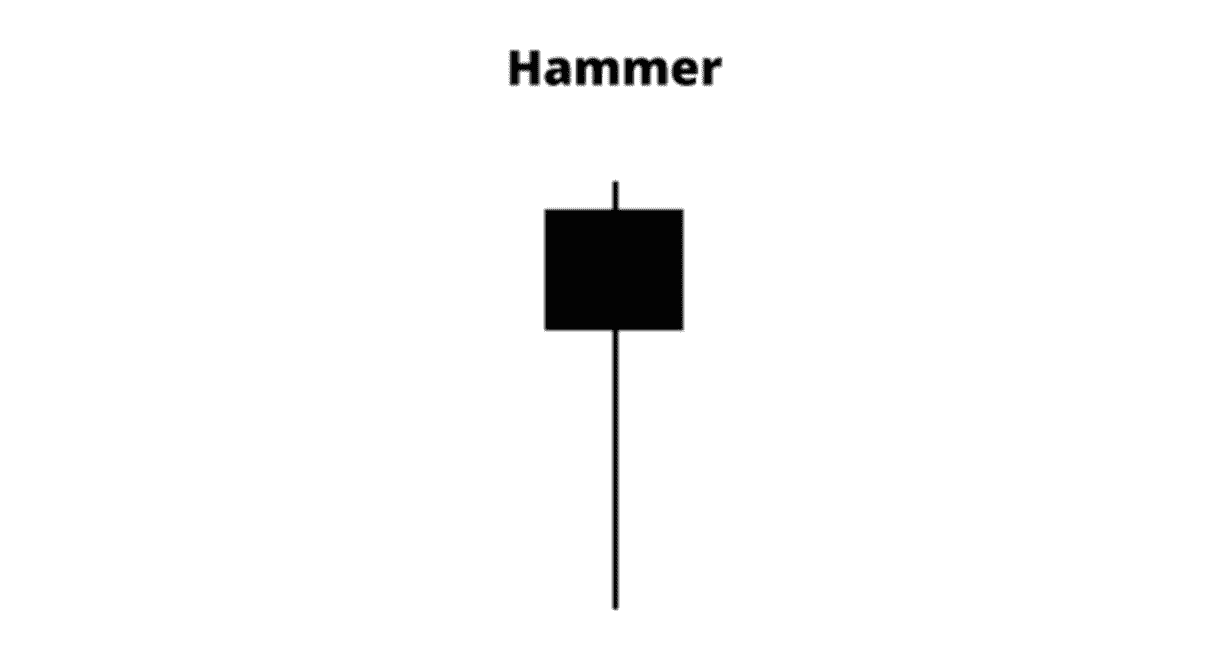
The hammer candlestick is a significant bullish reversal pattern that typically appears at the bottom of downtrends, signaling a potential shift in market sentiment from bearish to bullish. It consists of a small real body at the upper portion of the trading range with a long lower shadow (or wick) that's at least twice the size of the body.
The hammer-shaped candlestick chart pattern stands as one of the most reliable technical analysis tools for identifying potential trend reversals in cryptocurrency markets. This powerful pattern helps traders spot crucial turning points, particularly after prolonged downtrends, making it an essential component of any crypto trader's analytical toolkit.
This candlestick formation tells a compelling story of market psychology: sellers pushed the price significantly lower during the trading session, but buyers eventually gained control and drove the price back up near the opening level. This battle between bears and bulls, with bulls ultimately prevailing, creates the distinctive hammer shape.
The effectiveness of a hammer candlestick depends on several key factors:
• Market Context: A hammer appearing after a prolonged downtrend carries much stronger significance than one occurring randomly within a sideways market.
• Closing Position: When the hammer closes above its opening price creating a green/bullish body, it provides a stronger bullish signal.
• Volume: Increased trading volume accompanying the hammer formation strengthens the reversal signal.
How Does the Hammer Candlestick Pattern Work?
The hammer candlestick is a powerful visual signal that often marks the end of a downtrend and the start of a potential reversal. Recognizing its structure is essential for interpreting its message within the broader market context.
The hammer candlestick consists of:
1. A small body at the upper end of the trading range
2. Little to no upper shadow
3. A long lower shadow that's typically at least twice the length of the body
The color of the hammer's body (green/bullish or red/bearish) is less important than its shape and position in the overall trend. Whether the closing price exceeds the opening price, signaling a bullish trend, or falls below it, indicating a bearish trend, the hammer still conveys a potential bullish reversal when it appears after a downtrend.
What are the Typical Variations of the Hammer Pattern?
Before diving into strategy, it’s important to understand the common variations of the Hammer pattern and how each signals potential market reversals.
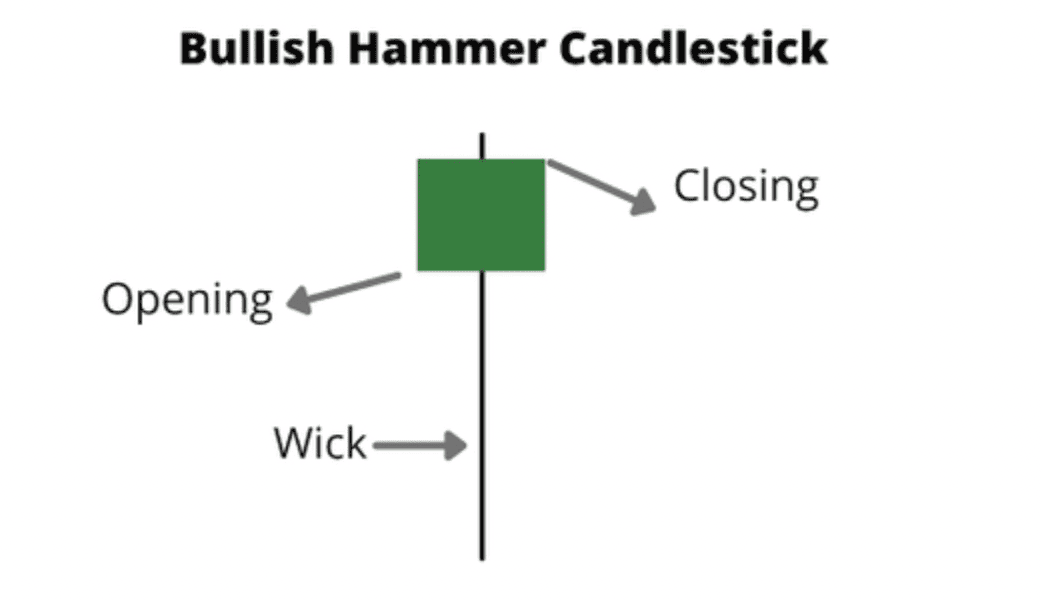
1. The Bullish Hammer
The classic bullish hammer emerges at the bottom of a downtrend. Its most powerful form occurs when the closing price exceeds the opening price, creating a green/bullish body. The long lower shadow demonstrates that sellers attempted to push prices lower but ultimately failed as buyers stepped in, signaling strong buying pressure.
2. The Bearish Hammer (Hanging Man)
While visually similar to the bullish hammer, the bearish hammer or "hanging man" appears at the top of an uptrend rather than the bottom of a downtrend. This pattern signals a potential bearish reversal, suggesting the price has reached an overbought condition and may soon decline.
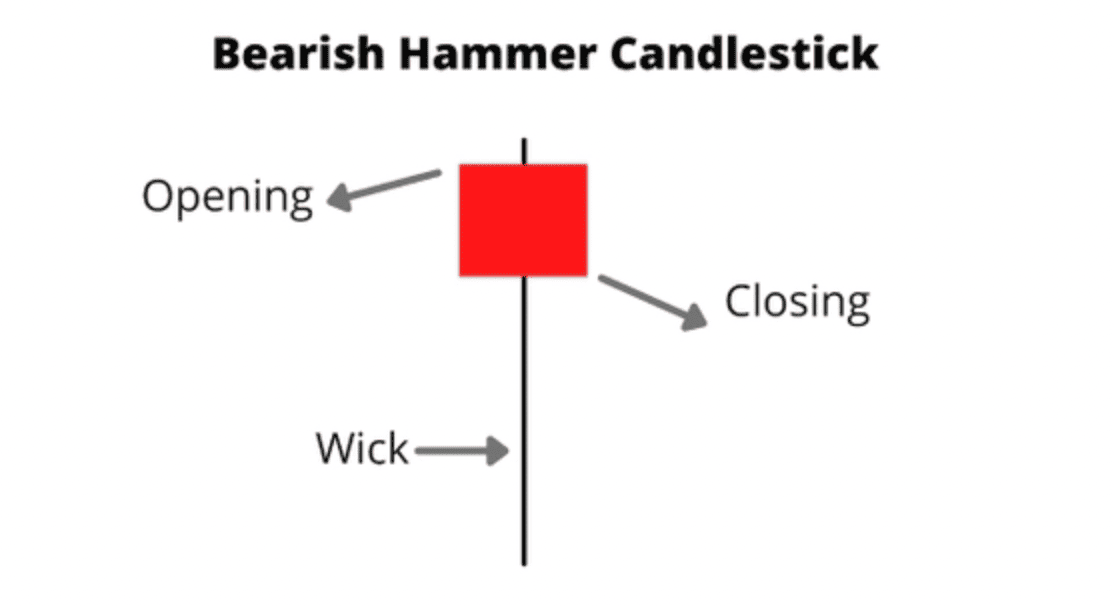
The key distinction between a hammer and a hanging man is context; the same candlestick formation carries opposite implications depending on where it appears within the market trend.
3. The Inverted Hammer
The inverted hammer also signals a potential bullish reversal after a downtrend, but with a different structure. Unlike the traditional hammer, the inverted hammer has a small body at the lower end of the trading range and a long upper shadow, with little to no lower shadow.
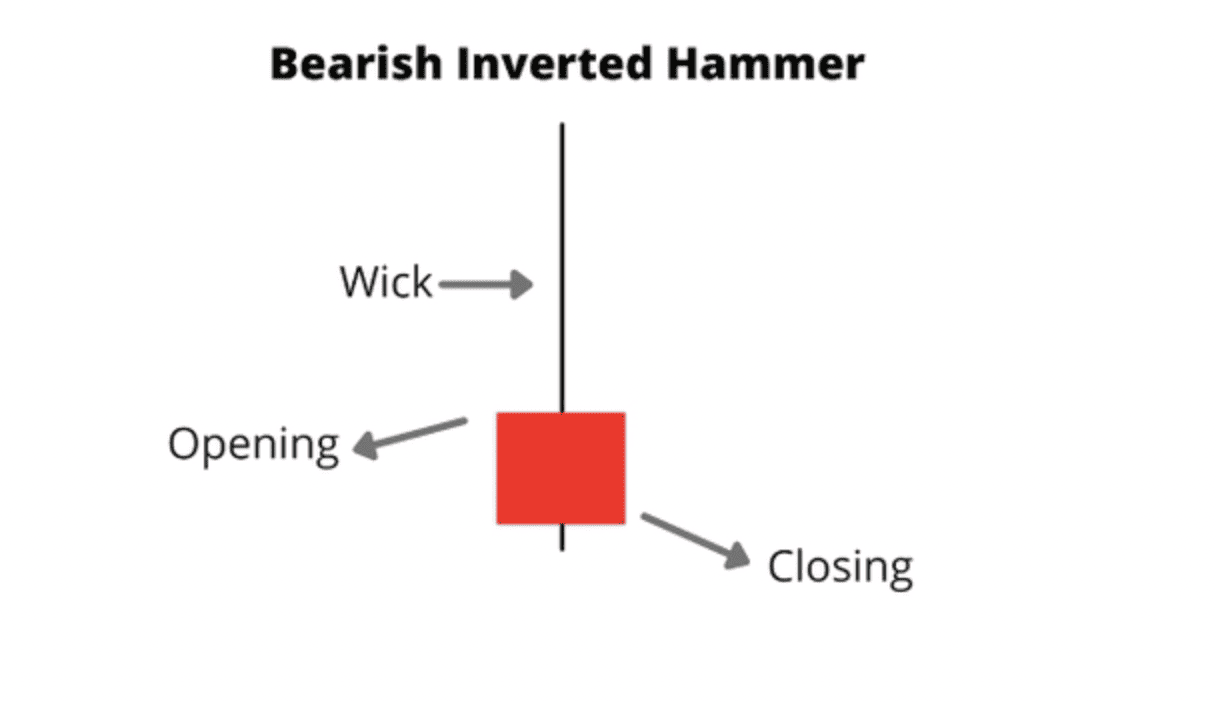
This pattern indicates that buyers attempted to push the price higher during the session (creating the upper shadow) but couldn't sustain the buying pressure. Nevertheless, the failure of sellers to drive prices lower suggests a weakening of the downtrend.
Top Trading Strategies Using Hammer Candlestick Patterns
To maximize trading success, it's crucial to use the hammer candlestick pattern in conjunction with other technical indicators and analytical tools. Here are three effective strategies:
Strategy 1: The Top-Bottom Strategy
This approach focuses on identifying strong downtrends that have broken below recent support levels. The strategy involves:
1. Recognizing a sustained downtrend that breaks through previous lows
2. Watching for indecisive candles followed by a hammer formation
3. Placing a buy stop order just above the high of the hammer candle
4. Setting a stop loss slightly below the hammer's shadow
5. Targeting a favorable risk-to-reward ratio (ideally 1:3 or better)
This strategy works particularly well in cryptocurrency markets where volatility can create pronounced downtrends followed by sharp reversals.
To execute this strategy successfully, the initial step is to identify a robust downtrend that has breached all recent lows.
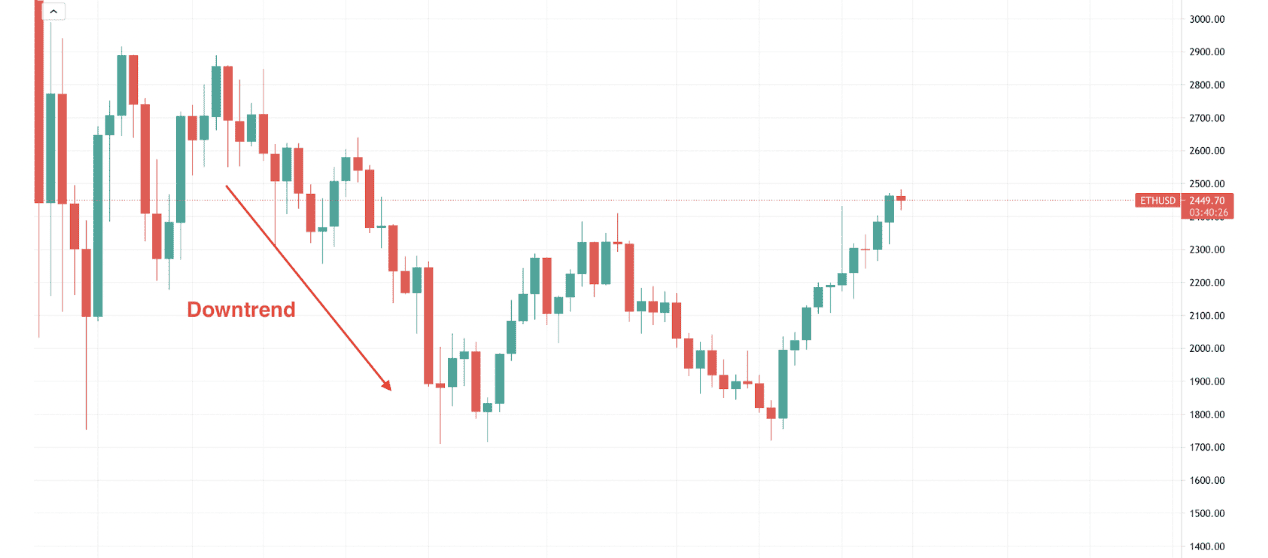 Source: ETH/USD Trading Chart on BingX
In the provided daily ETH chart, observe how the price steadily declines, breaking below the critical near-term low of 1800.00.
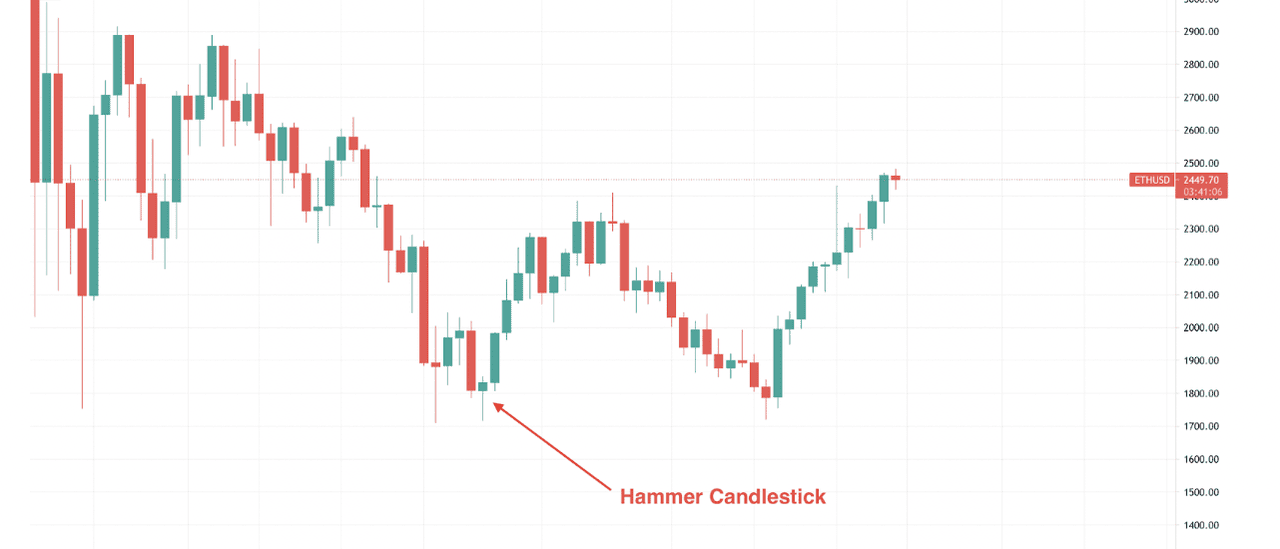 Source: ETH/USD Trading Chart on BingX
Once the price establishes a new low, it indicates the first signs of impending bullish pressure, characterized by an indecisive candle. Subsequently, despite bearish attempts to drive prices lower, the session concludes with a bullish hammer candle.
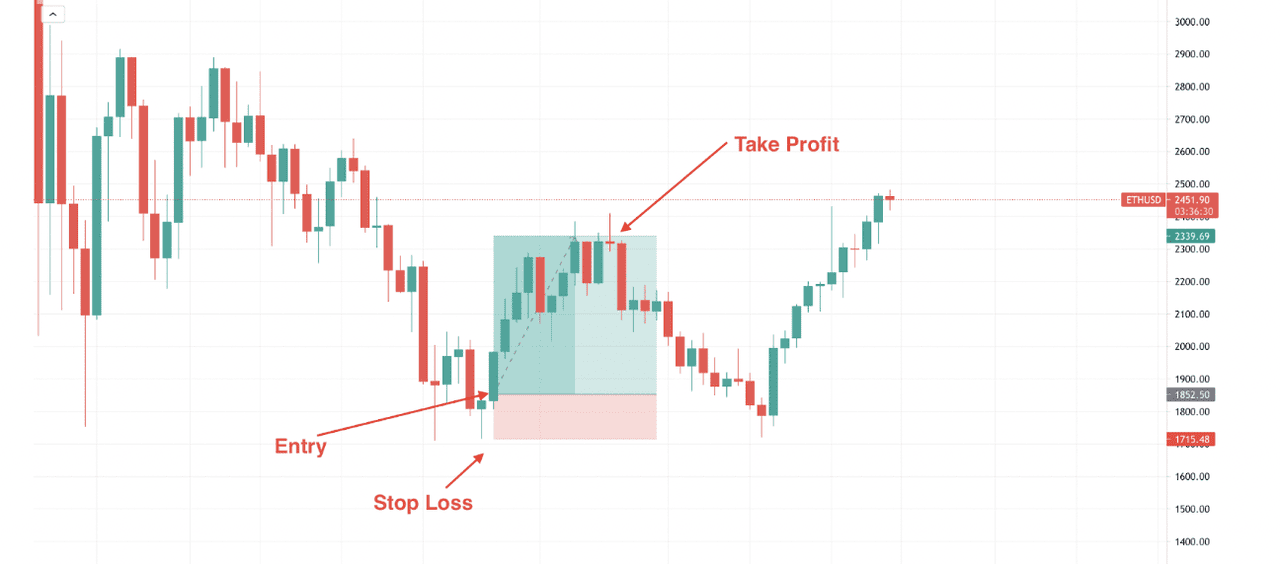 Source: ETH/USD Trading Chart on BingX
For optimal execution of this trading strategy, consider placing a buy stop order slightly above the high point of the hammer candle, while setting a stop loss just below the shadow, allowing for some buffer. In the example above, trade reaches its conclusion as soon as a bearish pin bar forms at the resistance level, offering a favorable risk-to-reward ratio of 1:3.5.
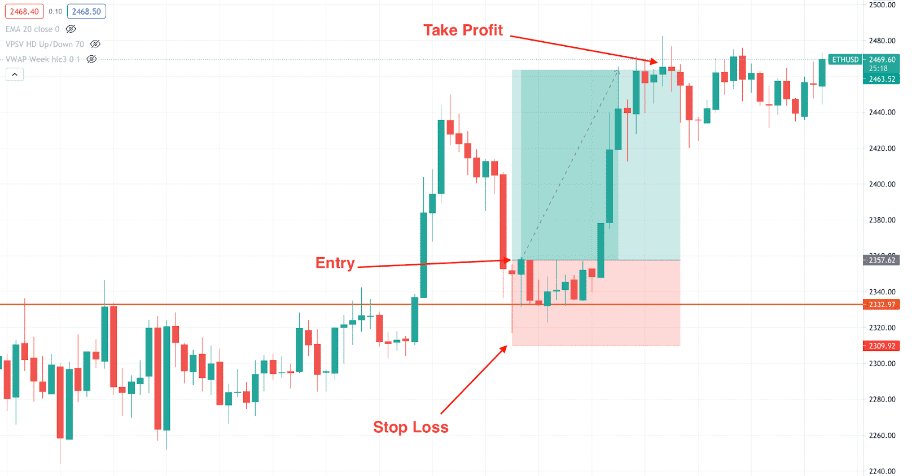
Strategy 2: Support and Resistance Strategy
Support and resistance levels act as psychological barriers that influence price movements. This strategy combines these key levels with hammer candlesticks:
1. Identify established support and resistance zones on the chart
2. Look for hammer patterns forming at support levels after a price decline
3. Enter a long position when the price confirms the bounce from support
4. Place a stop loss below the hammer's shadow
5. Target the next resistance level for taking profit
This approach enhances the hammer's reliability by adding the confluence of support levels, which often attracts buying interest.
In the intraday ETH chart above, the $2,332.97 level has acted both as resistance and support. As the price approaches this level, it breaks upward, fueled by strong buying momentum. The price then pulls back to this same level, offering a strategic entry point. At this juncture, traders can wait for confirmation before initiating an extended position.
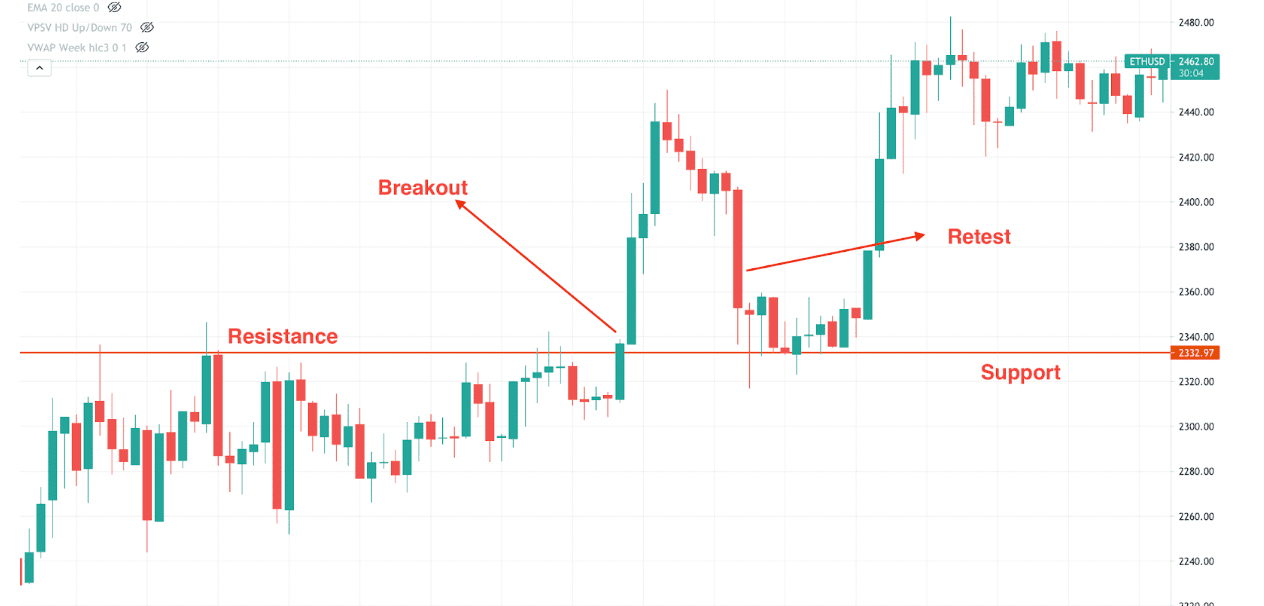 Source: ETH/USD Trading Chart on BingX
A buy signal is triggered when a hammer appears at the support zone; the stop-loss is placed just below the candle’s wick, allowing room for minor market swings. In the example shown, the trade concludes when a pin bar forms near resistance, achieving a risk-reward ratio of approximately 1:2.
 Source: ETH/USD Trading Chart on BingX
By combining clear support and resistance zones with confirmation from the hammer pattern, traders can enhance their decision-making and manage risk more effectively. Precision and discipline with technical signals are essential for navigating market fluctuations.
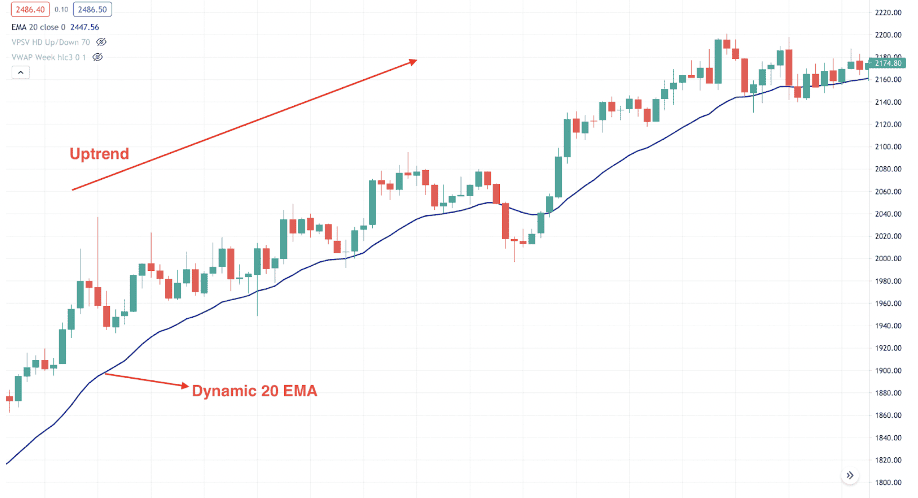
Strategy 3: Intraday Profitability with Moving Averages
For shorter timeframe traders, combining hammer patterns with moving averages creates a powerful system:
1. Establish the presence of an overall bullish trend
2. Use the 20 EMA (Exponential Moving Average) as a dynamic support level
3. Look for hammer candlesticks forming at or near the 20 EMA during pullbacks
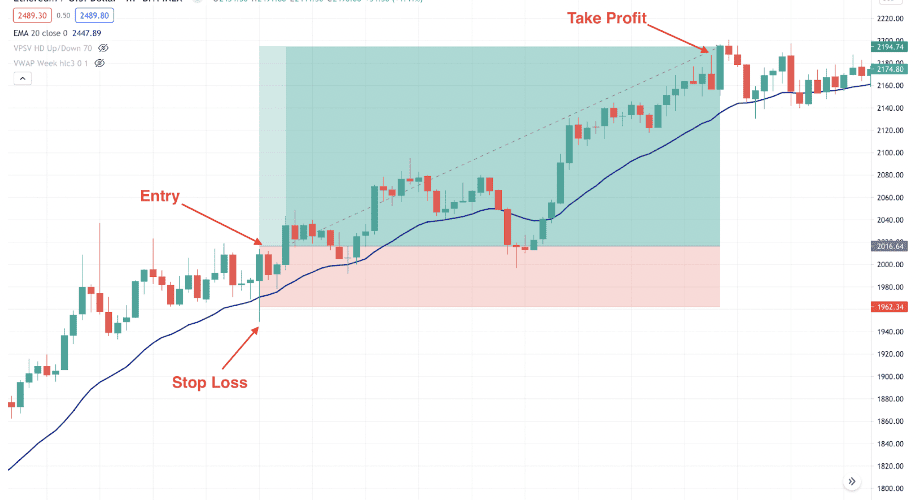
4. Enter long positions from the high point of the hammer candlestick
5. Set stops below the hammer's shadow
6. Target a risk-reward ratio of at least 1:2
This method simplifies intraday trading by using moving averages to confirm the broader trend direction, while hammer patterns identify precise entry points.
 Source: ETH/USD Trading Chart on BingX
In the illustration above, you can see how the price gravitates around the dynamic 20 EMA (Exponential Moving Average), which functions as a minor support level. In this context, the broader price trajectory is unmistakably bullish, and any price rebound from the dynamic 20 EMA represents an attractive buying opportunity.
 Source: ETH/USD Trading Chart on BingX
The buy position becomes valid from the high point of the hammer candlestick, with the placement of a stop loss positioned just below the candle's shadow, allowing for a comfortable margin of safety. In the provided example, the trade concludes as soon as a pin bar materializes at the resistance level, delivering a favorable risk-to-reward ratio of 1:2.
This method, rooted in the use of Moving Averages, simplifies intraday trading, especially within prevailing trends. By combining the hammer candlestick's confirmation with this strategy, traders can enhance their precision and capitalize on lucrative market opportunities. It is worth emphasizing that trading success hinges not just on strategy but also on prudent risk management practices.
Hammer vs. Doji Chart Patterns: A Comparative Analysis
While both hammer and doji patterns can signal potential trading opportunities, they communicate different market conditions:
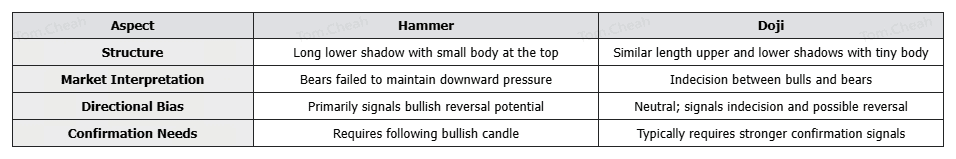
Doji patterns indicate market equilibrium where neither buyers nor sellers gained significant ground, while hammers specifically show buyers overcoming selling pressure after a price decline.
What Are the Advantages and Limitations of the Hammer Candlestick Pattern?
While the Hammer candlestick is a valuable tool for spotting trend reversals, it’s essential to weigh its strengths against its limitations for more effective trading decisions.
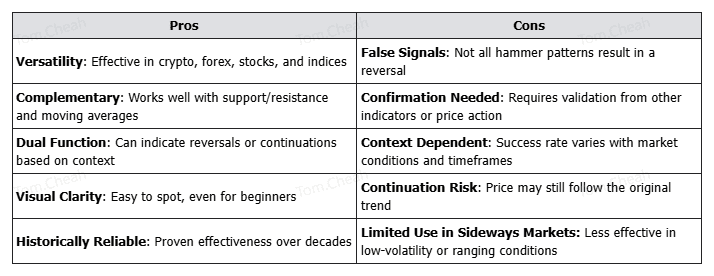
Pros
• Versatility: Works across multiple markets, including cryptocurrencies, forex, stocks, and indices
• Complementary: Integrates well with other technical tools like support/resistance and moving averages
• Dual Function: Can signal both reversals and continuations depending on context
• Visual Clarity: Easy to identify on charts with minimal experience
• Historical Reliability: Has demonstrated effectiveness over decades of market analysis
Cons
• False Signals: Not every hammer pattern leads to a price reversal
• Confirmation Requirement: Requires additional validation through other indicators or subsequent price action
• Context Dependency: Effectiveness varies greatly depending on market conditions and timeframes
• Risk of Continuation: Despite the hammer formation, prices may continue in the previous trend direction
How to Use Hammer Candlestick Patterns in Crypto Trading
To make the most of Hammer candlestick patterns, it’s important to know how to identify them correctly and apply them within your broader crypto trading strategy:
1. Wait for Confirmation: Always look for a strong bullish candle following the hammer pattern before entering a position
2. Volume Verification: More reliable signals occur when the hammer forms with above-average volume
3. Multiple Timeframe Analysis: Confirm the hammer's significance across different time horizons
4. Risk Management: Never risk more than a small percentage of your portfolio on a single hammer-based trade
5. Combined Approach: Use hammers in conjunction with other technical indicators like RSI, MACD, or Fibonacci levels
6. Market Awareness: Consider the broader cryptocurrency market sentiment and potential news catalysts
Conclusion
The hammer candlestick pattern serves as a valuable tool for identifying potential trend reversals in cryptocurrency markets. Its distinctive shape tells a compelling story of market psychology, revealing moments when buyers step in to overcome selling pressure after a downtrend.
While no pattern guarantees trading success, incorporating hammer candlesticks into a comprehensive trading strategy can significantly enhance decision-making. By understanding the pattern's variations, combining it with complementary technical tools, and practicing proper risk management, cryptocurrency traders can effectively leverage this time-tested pattern to identify promising trading opportunities.
Remember that successful trading requires continuous learning and adaptation. The hammer pattern is just one tool in an extensive technical analysis arsenal. Still, when properly applied, it can provide valuable insights into potential market turning points and help traders make more informed decisions in the volatile cryptocurrency markets.
Related Reading
5. Simple Moving Average(SMA) vs Exponential Moving Average(EMA) in Crypto Trading: Differences to Know
FAQs on Hammer Candlestick Pattern
1. What is a hammer candlestick and why is it important?
A hammer is a bullish reversal candlestick that appears after a downtrend. It has a small body at the top of the session’s range and a long lower wick (at least twice the body), signaling buyer dominance after initial selling pressure.
2. How can I confirm a valid hammer signal?
Look for a hammer at the bottom of a downtrend. Confirmation comes from:
• A close above the open (bullish body)
• Increased volume
• A follow‑through bullish candle the next session
3. What are the main variations of the hammer chart pattern?
The Hammer pattern comes in several key variations, each offering unique insights into potential market reversals depending on their shape and position in the trend:
• Traditional hammer: long lower wick, small upper body
• Inverted hammer: long upper wick, small lower body—also bullish at downtrend bottoms
• Hanging man: identical shape to a hammer but appears at the top of an uptrend, signaling possible bearish reversal
4. What popular trading strategies use hammer patterns?
Hammer patterns are commonly used in various trading strategies that combine candlestick analysis with indicators like volume, support/resistance, and trendlines to improve trade accuracy.
• Top-Bottom Strategy: Enter long after a hammer forms following a break below support, placing the stop below its wick.
• Support & Resistance Strategy: Trade hammers appearing at key support zones, with stop-loss below the wick and targets at resistance.
• EMA-Based Intraday Strategy: Use a 20 EMA as support on shorter timeframes. Enter when a hammer forms at or near the EMA, with a tight stop and 1:2+ risk-reward ratio.
5. How does a hammer differ from a doji?
A doji has equal or nearly equal open and close prices, indicating indecision. A hammer displays strong buyer rejection, sellers push low, but buyers force a recovery, making it a more actionable reversal signal.
6. How can I enhance the reliability of hammer signals?
To enhance the reliability of hammer candlestick signals, wait for a confirmation candle that closes bullishly after the hammer forms. Look for above-average trading volume, confirm the pattern across multiple timeframes, and apply strict risk management. You can also strengthen the setup by combining it with technical indicators like RSI, MACD, or Fibonacci retracement levels.