Meta Description: Parabolic SAR (PSAR) is a trend-following indicator that signals reversals. Learn how to trade crypto with PSAR using BingX charts, strategies, and examples.
In the fast-paced and volatile world of cryptocurrency trading, having reliable technical tools that can quickly identify market momentum and potential reversals is essential. This is where the Parabolic Stop and Reverse (PSAR) indicator becomes invaluable for crypto traders seeking to optimize their entry and exit positions.
To understand how the Parabolic SAR delivers these trading advantages, it's crucial to grasp what it is and how it functions within the broader ecosystem of technical indicators.
What Is Parabolic Sop and Reverse(SAR) Indicator?
The Parabolic Stop and Reverse (SAR), also known as PSAR, is a key technical indicator used to track price trends in trading. Initially developed in the 1970s by renowned market expert J. Welles Wilder Jr., the Parabolic SAR is a trend-following tool designed to signal potential reversals in price direction, much like the Moving Average Convergence Divergence (MACD), which also highlights trend shifts. The indicator reacts to price changes with minimal lag, making it ideal for traders who need timely execution and consistent strategy signals.
PSAR helps traders anticipate when momentum is likely to change, offering timely entry and exit signals. It is widely used in crypto, forex, futures, and equities trading. Its design is particularly suited to crypto trading, where strong directional momentum and sudden reversals are common. At BingX, traders can integrate the Parabolic SAR into their strategies to enhance decision-making and refine entry and exit points.
How to Calculate the Parabolic SAR Indicator
The Parabolic SAR is calculated using a formula that tracks price trends based on recent highs and lows. The formula is:
SARₙ = SARₙ₋₁ + AF × (EPₙ₋₁ – SARₙ₋₁)
Where:
• SARₙ: Current SAR value.
• SARₙ₋₁: Previous SAR value.
• AF: Acceleration factor, starting at a default of 0.02 and increasing with trend strength.
• EPₙ₋₁: Previous extreme point, representing the highest high or lowest low.
As a trend strengthens, the acceleration factor (AF) increases, pulling the SAR dots closer to price, which helps the indicator react to momentum changes. However, to prevent over-sensitivity and false signals, a maximum acceleration (MA) parameter limits AF’s growth.
Why Use Parabolic SAR in Crypto Trading?
The Parabolic SAR (Stop and Reverse) is a powerful tool for navigating the fast-moving and highly volatile cryptocurrency markets. Known for their rapid trend shifts, crypto markets demand tools that offer quick, visual insights and structured trade management. The Parabolic SAR excels in this environment by providing:
• Clear Visual Cues: Instantly shows when a trend might be reversing through simple dot placements above or below price action.
• Objective Entry and Exit Signals: Helps traders identify when to open or close positions with minimal ambiguity.
• Dynamic Stop-Loss Adjustments: The PSAR acts as a stop-loss tool, automatically trailing the price to lock in profits and limit losses, adjusting in line with momentum.
• High Effectiveness in Trending Markets: Especially when paired with Heikin Ashi charts, the Parabolic SAR has shown a success rate of up to 63% in backtested strategies, far outperforming the 19% seen in traditional Open-High-Low-Close (OHLC) setups. This performance can be further improved when PSAR is paired with complementary indicators, such as related strength index (RSI), Moving Averages, or average directional index (ADX), which help confirm trend strength and filter out false signals. We’ve covered these advanced combinations in a dedicated section below to help you build more reliable, multi-layered trading strategies.
With a solid understanding of its characteristics, let’s now explore how the Parabolic SAR is calculated and how its values shift in response to live price action.
How the Parabolic SAR Works in Crypto
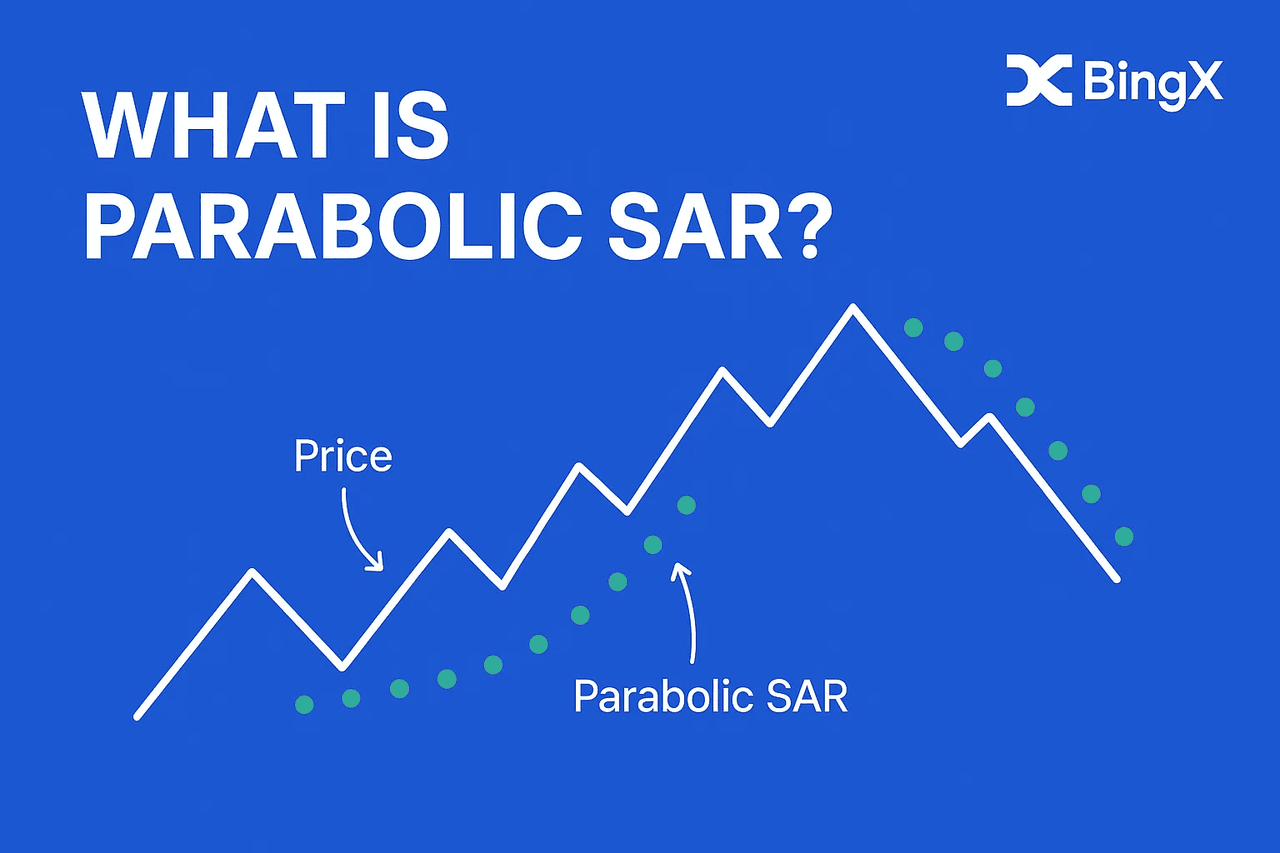
The Parabolic SAR plots a series of dots above or below price bars to indicate the current trend. Dots below the price suggest an uptrend, while dots above signal a downtrend. These shifts offer traders a visual method to track momentum and spot potential trend reversals directly on the chart.
Understanding the Parabolic SAR Dots
The Parabolic SAR (Stop and Reverse) indicator appears on crypto charts as a series of dots plotted either above or below the price bars. These dots serve as a visual representation of the current market trend:
• Dots Below Price: When the SAR dots appear below the price bars, they indicate an uptrend or bullish market condition. These dots act as a form of dynamic support level.
• Dots Above Price: When the SAR dots appear above the price bars, they signal a downtrend or bearish market condition. In this scenario, the dots function as a dynamic resistance level.
The position of these dots relative to price provides crypto traders with immediate visual cues about the market direction. When the dots switch positions (from above price to below, or vice versa), it signals a potential trend reversal that may warrant entering or exiting a position.
To fully understand the behavior of the SAR dots, we need to look under the hood at the key components driving this indicator.
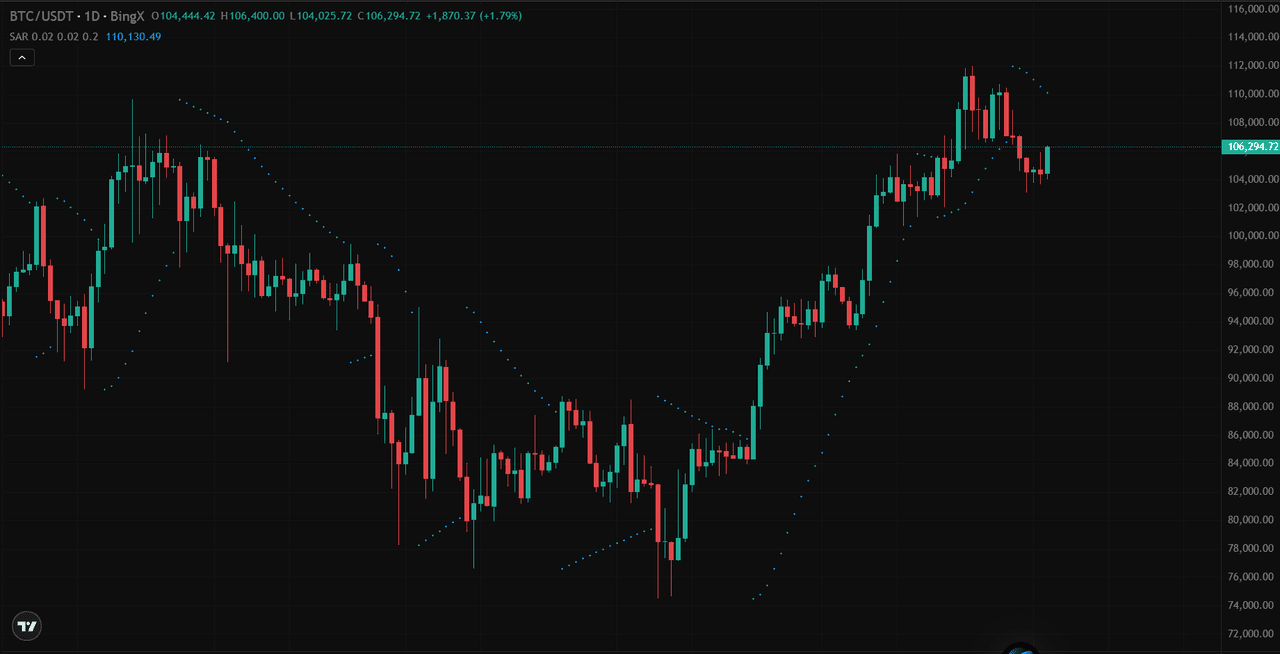
Source: BTC/USDT Trading Chart on BingX
Tracking the Extreme Point (EP) and Acceleration Factor (AF)
The Parabolic SAR calculation relies on two primary components:
1. Extreme Point (EP): The EP represents the highest point reached during an uptrend or the lowest point reached during a downtrend. This value essentially tracks the most extreme price movement in the current trend's direction.
2. Acceleration Factor (AF): The AF determines how closely the SAR dots follow the price. It starts with a default value (typically 0.02) and increases incrementally (usually by 0.02) each time a new extreme point is recorded, up to a maximum value (usually 0.20).
This increasing acceleration factor creates the "parabolic" nature of the indicator, causing the dots to accelerate and move closer to the price as the trend continues and strengthens.
The mathematical formula for calculating the Parabolic SAR is:
• For Uptrend: PSAR = Prior SAR + Prior AF × (Prior EP – Prior SAR)
• For Downtrend: PSAR = Prior SAR - Prior AF × (Prior SAR – Prior EP)
While the underlying formula offers flexibility, most platforms provide optimized default settings that suit a wide range of crypto trading styles.
Default Settings on Trading Platforms
Most crypto trading platforms, including BingX, apply the following default Parabolic SAR settings:
• Initial Acceleration Factor (AF): 0.02
• Acceleration Factor Step: 0.02 (the amount by which AF increases when new extreme points are reached)
• Maximum Acceleration Factor: 0.20
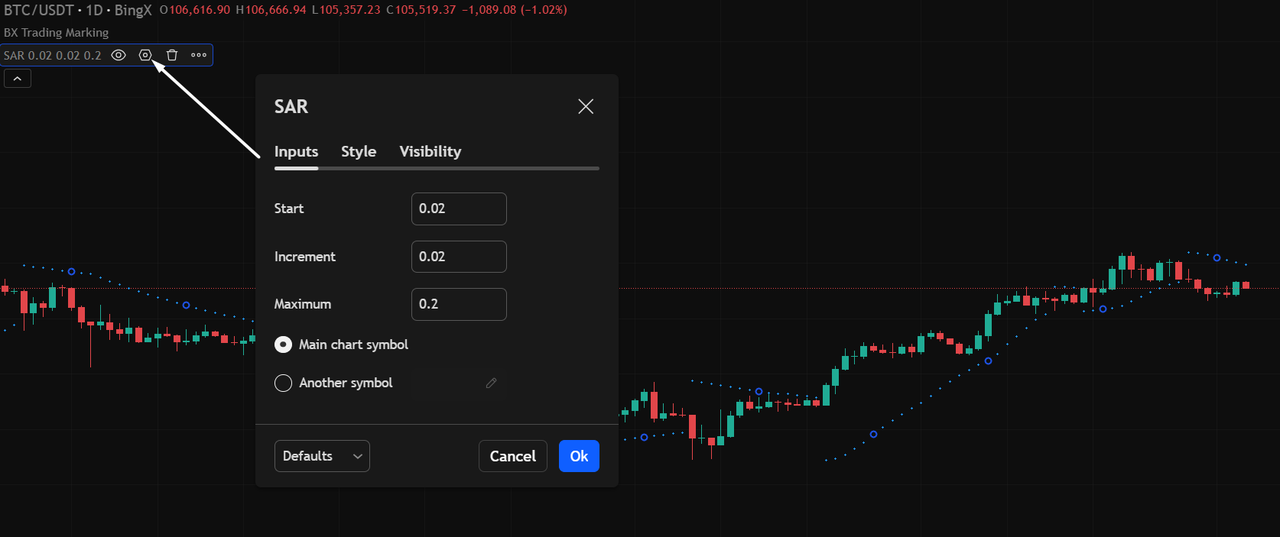
Source: BTC/USDT Trading Chart on BingX
These default settings have been found to work well across various crypto assets and timeframes. However, many experienced traders adjust these parameters based on:
1. The specific cryptocurrency volatility
2. The trading timeframe (shorter timeframes may benefit from lower AF values)
3. Individual trading styles and risk tolerance
Interpreting SAR dots correctly can unlock powerful entry and exit opportunities. Here's how to recognize and act on the most common SAR signals in crypto markets.
Key Trading Signals
1. Buy Signal: Dots below price with a steeper upward slope, suggesting a strengthening uptrend.
2. Sell Signal: Dots above price with a steeper downward slope, indicating increasing downward momentum.
3. Neutral/Wait: In sideways or consolidating markets, SAR dots may flatten and become less reliable. Waiting for a breakout before trading is recommended.
The most critical signal in PSAR trading is when the dots cross the price level, indicating a potential trend reversal. This crossover suggests it might be time to switch from a long to short position or vice versa.
Top Benefits of Parabolic SAR for Crypto Traders
Beyond theory, here are the key advantages crypto traders gain when incorporating the Parabolic SAR into their real-world trading strategy.
1. Identify Trend Direction Instantly
The Parabolic SAR provides immediate visual feedback about market direction. With dots placed below price bars during uptrends and above price bars during downtrends, traders can instantly recognize the current trend without complex analysis:
• Visual Clarity: Unlike indicators requiring interpretation of crossovers or convergence patterns, the Parabolic SAR offers straightforward visual cues that can be understood at a glance.
Source: BTC/USDT Trading Chart on BingX
• Early Identification: The indicator often spots emerging trends in their early stages, allowing crypto traders to capitalize on movements before they become obvious.
2. Provide Clear Buy and Sell Signals
The Parabolic SAR generates unambiguous trading signals when dots flip positions:
1. Buy Signal: When dots flip from above price to below it, suggesting a shift from downtrend to uptrend.
2. Sell Signal: When dots flip from below price to above it, indicating a potential shift from uptrend to downtrend.
Source: BTC/USDT Trading Chart on BingX
These clear signals eliminate guesswork in determining entry and exit points, making the indicator valuable for traders who prefer systematic approaches.
3. Optimize Entry, Exit, and Risk Management
The Parabolic SAR excels at position management:
• Dynamic Stop-Loss Levels: The dots indicate adaptive stop-loss points that adjust in response to trend development, particularly valuable in volatile cryptocurrency markets.
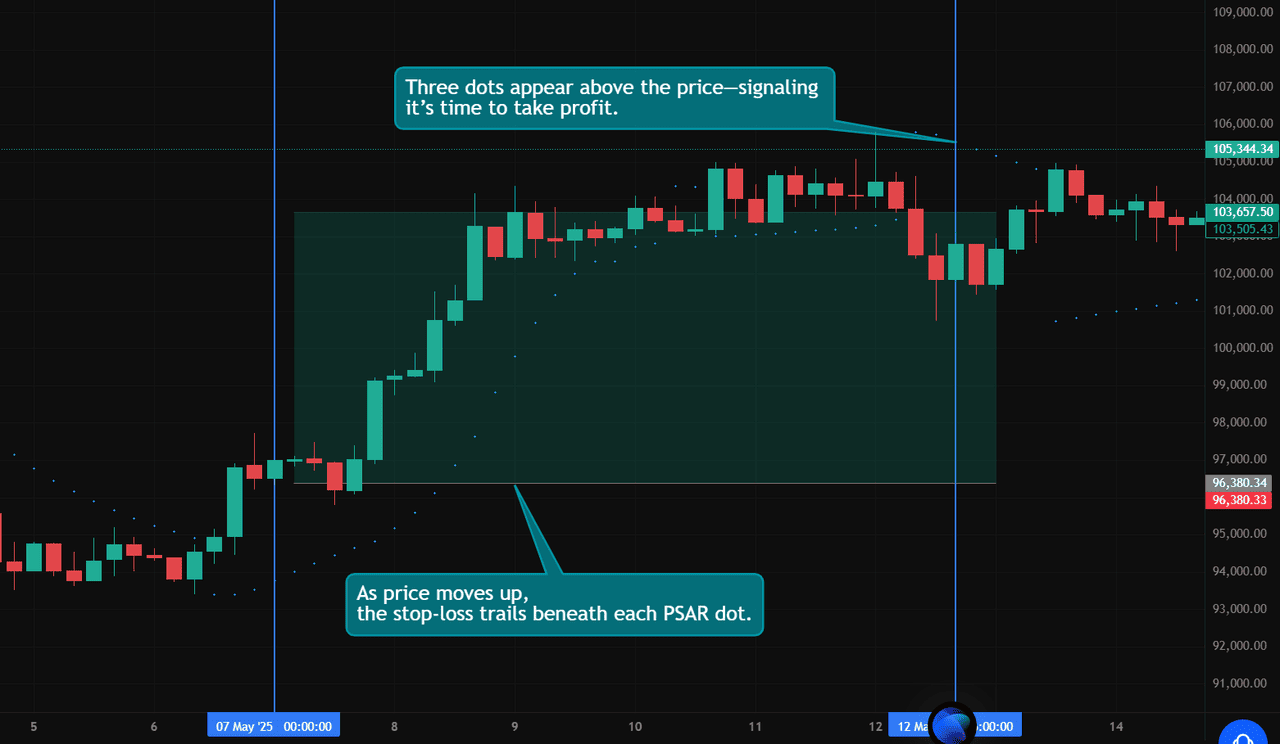
• Trailing Stop Mechanism: As trends strengthen, dots accelerate, allowing traders to protect profits while giving positions room to develop.
• Profit Target Setting: The increasing distance between price and dots helps traders gauge trend strength and set appropriate profit targets.
Source: BTC/USDT Trading Chart on BingX
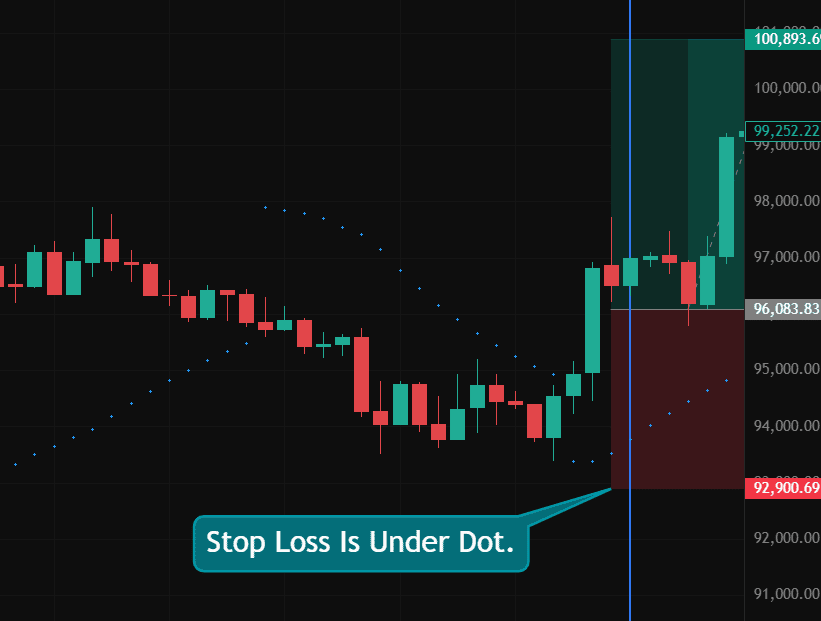
For instance, a long position is opened at $96,100 after a bullish breakout. At the time of entry, the PSAR dot is located near $93,500, so the stop-loss is placed just below it to manage risk.
Source: BTC/USDT Trading Chart on BingX
As the PSAR dots flip above the price near $105,300, it signals a potential reversal. The trader exits the position at this level, capturing a $9,200 gain while risking just $2,600, achieving a favorable risk-reward ratio of approximately 3.5:1.
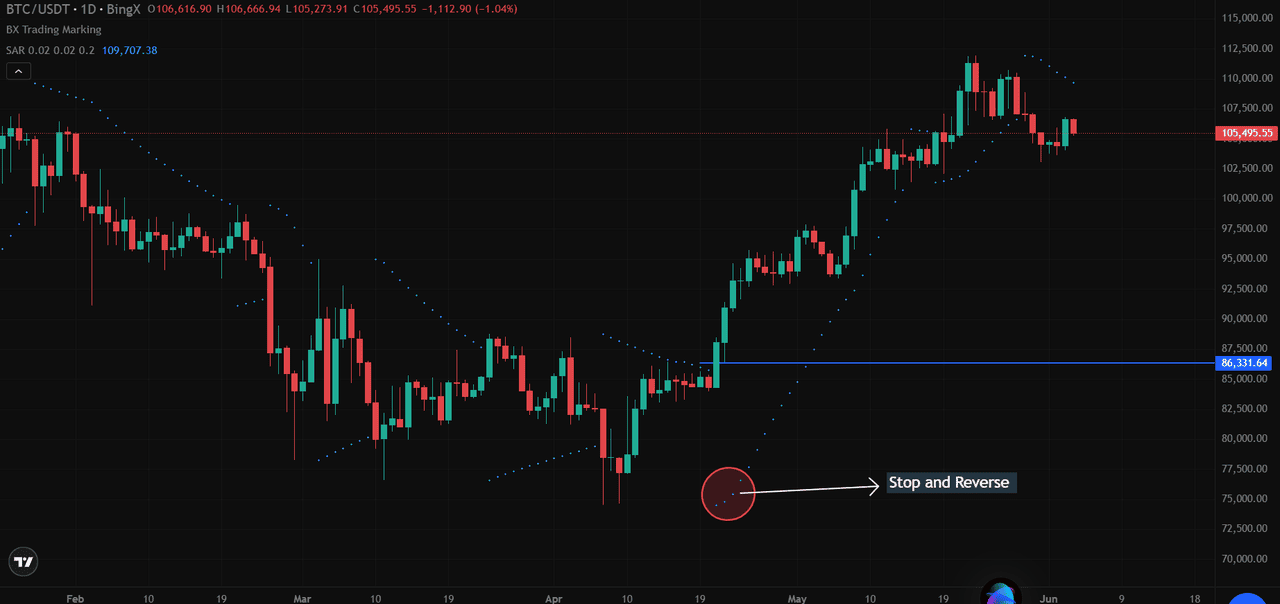
4. Function as a Reverse Indicator in Fast-Moving Markets
The "Stop and Reverse" nature suits crypto markets with rapid reversals:
• Quick Adaptation: When market direction changes, dots quickly flip sides, alerting traders to potential reversal opportunities.
• Reduced Signal Lag: Compared to moving average-based indicators, the Parabolic SAR often generates signals earlier, giving traders an edge in fast-moving cryptocurrency markets.
The combination of these benefits makes the Parabolic SAR a powerful tool for crypto traders, particularly when used within a comprehensive strategy that accounts for its strengths in trending markets and limitations during sideways conditions.
Parabolic SAR Strategy for Different Trading Timeframes
The Parabolic SAR offers distinct advantages depending on your trading horizon:
1. Day Trading: Using 15-minute or hourly charts allows for capturing multiple SAR-based trades during volatile crypto sessions, with tight stop-loss settings
2. Swing Trading: On 4-hour or daily charts, the SAR helps identify multi-day trends with fewer false signals
3. Position Trading: Weekly charts provide major trend signals for longer-term holdings
Tactical Entry and Exit Framework
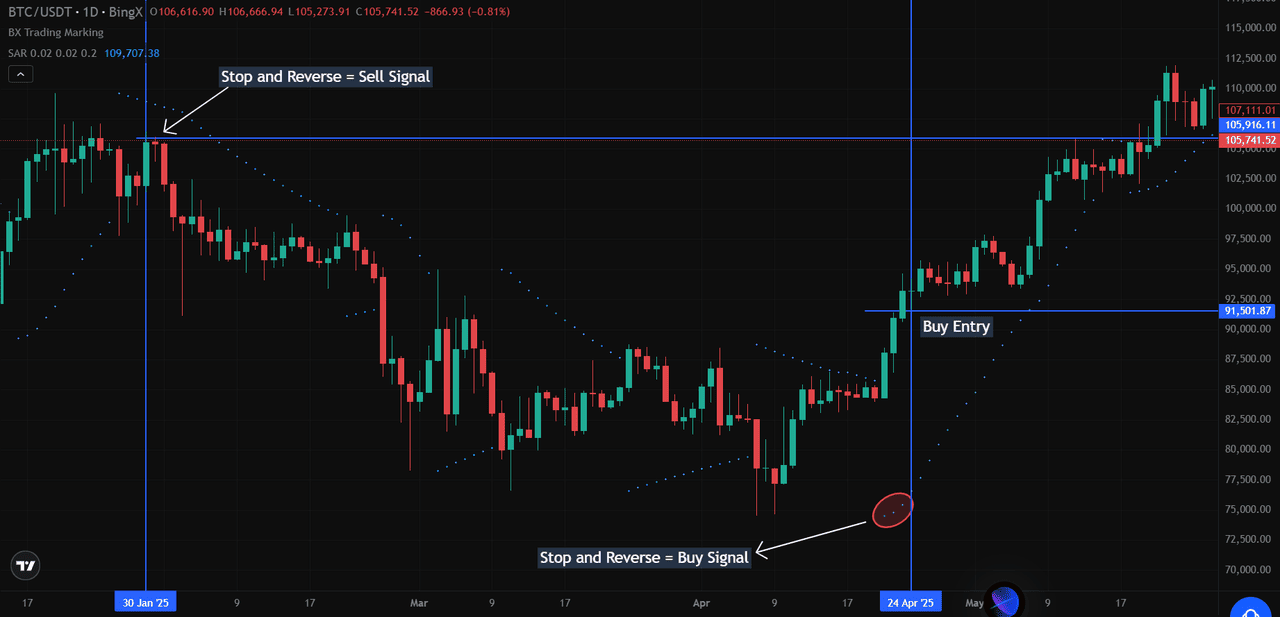
Looking at the BTC/USDT chart from BingX, we can identify two significant signals:
1. Sell Signal (January 30, 2025): The dots flipped above price around $107,000, preceding a substantial decline to nearly $75,000, representing a potential 30% profit opportunity for short positions.
2. Buy Signal (April 24, 2025): Dots flipped below price at approximately $91,500, marking the beginning of a rally toward $110,000, a 20% upside move for traders who followed this signal.
Source: BTC/USDT Trading Chart on BingX
The ideal trade execution involves:
• Entering within 1-3 candles after the dot flip
• Setting initial stops at the level of the first SAR dot after reversal
• Adjusting position size based on the distance to the stop-loss
Fine-Tuning the Acceleration Factor
While BingX uses the standard 0.02/0.02/0.2 settings (visible in the chart's upper left corner), experienced traders adapt these parameters:
• For Bitcoin: Lower settings (0.015 initial, 0.15 maximum) often work better due to BTC's large market cap and somewhat lower volatility compared to altcoins
• For Altcoins: Higher settings (0.025 initial, 0.25 maximum) may capture faster-moving trends in smaller cap cryptocurrencies
• Market Cycle Adjustment: Decrease settings in ranging markets; increase during strong bullish/bearish cycles
Enhanced Signal Validation Framework
Research shows that combining indicators dramatically improves Parabolic SAR performance:
1. Volume Confirmation: Only take signals accompanied by above-average volume (at least 1.5x the 20-period average)
2. RSI Alignment Strategy:
• For buy signals: Enter only when RSI rises above 40 after being oversold
• For sell signals: Enter only when RSI falls below 60 after being overbought
3. Moving Average Filter:
• For buy signals: Price should close above the 50-period EMA
• For sell signals: Price should close below the 50-period EMA
4. ADX Threshold System: Implement a minimum ADX reading of 22 to confirm trend strength before taking SAR signals
Identifying Trend Reversals with SAR Signals
Using the same BTC/USD chart as above, the April 24th reversal on the BTC/USDT chart showcases how the Parabolic SAR can help identify trend shifts through key patterns. In early April, SAR dots began clustering closer to price, signaling decelerating bearish momentum.
This was followed by a failed continuation to the downside and confirmation from SAR flips on lower timeframes.
The actual buy signal occurred near a key support level around $91,500. Combined, these factors led to a sharp 20% rally in Bitcoin. This example highlights how SAR, when paired with price action and strategic risk management, can effectively anticipate major trend reversals in crypto markets.
How to Combine Parabolic SAR with Other Indicators
While the Parabolic SAR offers valuable trend reversal signals, it performs even better when combined with other technical indicators. This layered approach helps confirm signals, avoid false entries, and enhance accuracy, especially in fast-moving crypto markets like BTC/USDT.
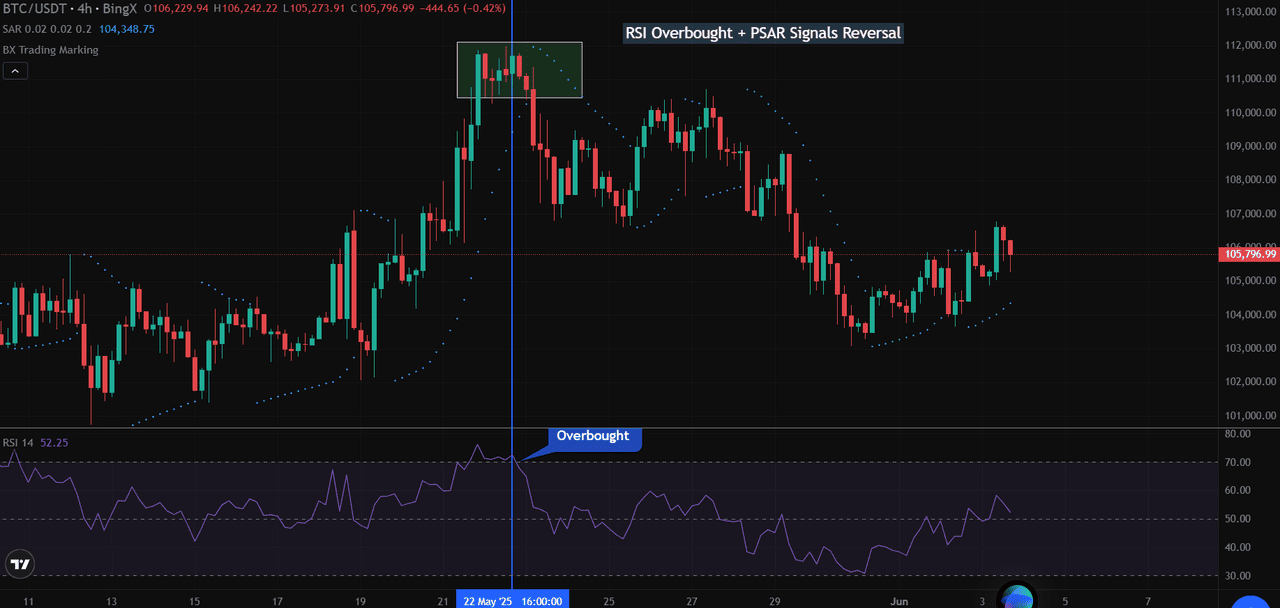
1. PSAR + RSI: Spotting Overbought Reversals with Confidence
On May 22, 2025, BTC/USDT surged above $111,000 and entered overbought territory as the Relative Strength Index (RSI) surpassed 70. At the same time, Parabolic SAR dots flipped from below to above the price, indicating a bearish reversal.
Source: BTC/USDT Trading Chart on BingX
This dual confirmation, RSI overbought plus PSAR flip, offered a strong sell signal. What followed was a sharp trend reversal that pushed BTC down by nearly 6%, reinforcing the value of this combo for spotting market tops.
2. PSAR + Moving Average: Confirming the Trend Shift
Looking at the same reversal area around May 23, we notice a 9-period Moving Average (MA) crossing below price action as BTC starts declining from its peak. The PSAR dots remained above the candles, signaling a bearish trend.
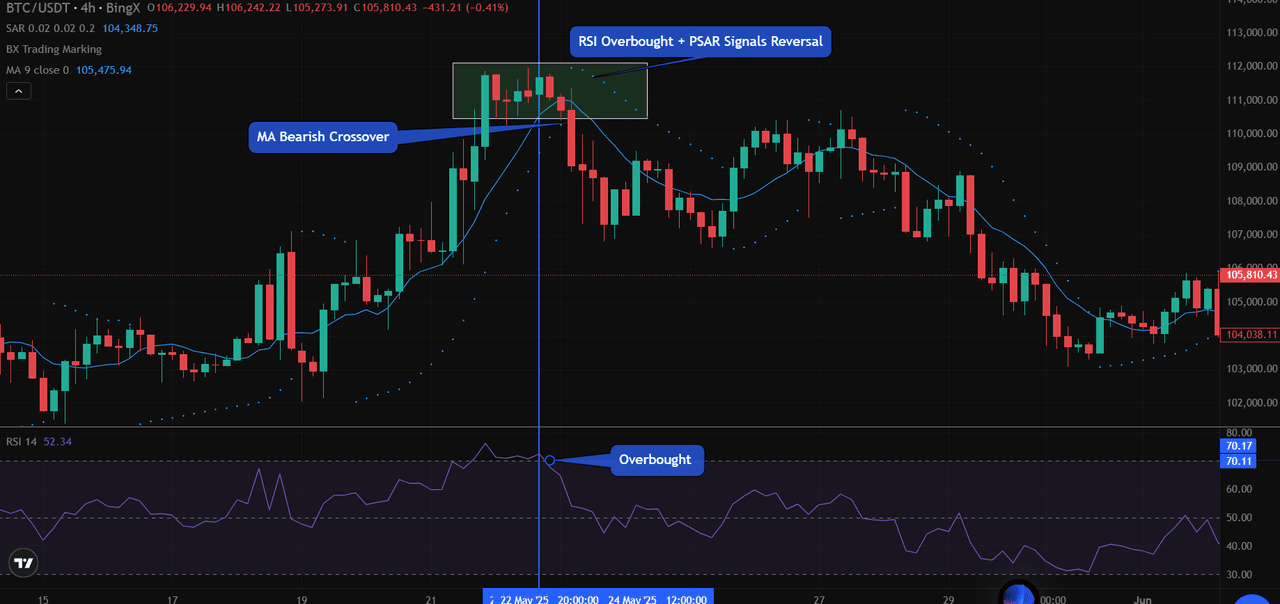
Source: BTC/USDT Trading Chart on BingX
The MA slope also flattened and reversed downward, confirming weakening bullish momentum. This combination, PSAR, confirming the shift and MA supporting trend direction, helped validate the reversal for those waiting for additional confirmation before entering short positions.
3. PSAR + ADX: Measuring Trend Strength Before It Breaks
On May 20–22, BTC/USDT traded within a strong uptrend, with ADX readings climbing above 25, confirming trend strength. But by May 23, just as PSAR dots flipped to signal a trend reversal, the ADX line began to fall, indicating a loss of bullish momentum.
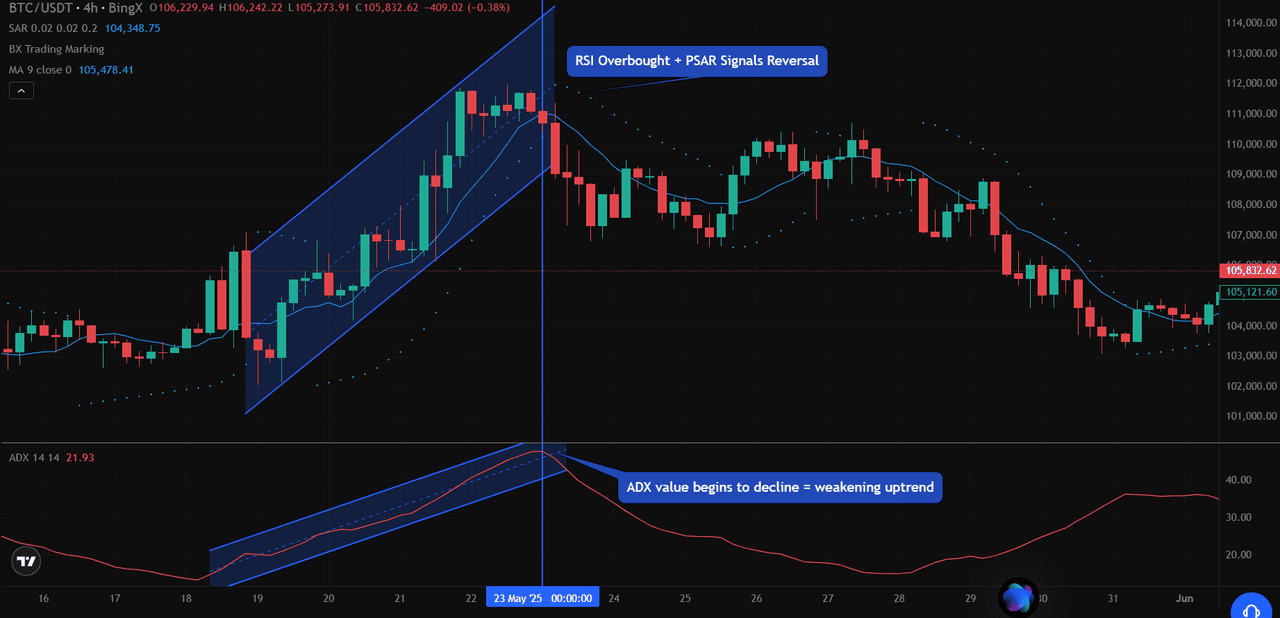
Source: BTC/USDT Trading Chart on BingX
This decline in trend strength, combined with the PSAR reversal and overbought RSI, offered a triple-signal setup to anticipate the pullback more confidently.
When to Avoid Parabolic SAR: Limitations
Despite its strengths, the Parabolic SAR is not a one-size-fits-all solution. Its performance diminishes in sideways or consolidating markets, where price moves within a tight range. In these conditions, the SAR dots tend to flip back and forth frequently, triggering false trading signals that can result in whipsaws, rapid, minor reversals that erode capital.
For example, if BTC/USDT trades between $104,000 and $106,000 without establishing a clear trend, the SAR will rapidly shift between buy and sell signals within days, offering little directional value. In such non-trending periods, relying solely on the SAR can lead to premature entries and stop-outs.
Additionally, SAR does not account for volume, trend strength, or overbought/oversold conditions, which makes it prone to misinterpretation without the support of indicators like RSI or ADX. This is why professional traders often combine the SAR with other technical analysis tools to confirm signals and reduce risk.
The indicator also struggles with news-driven volatility, where sudden spikes or drops can invalidate a signal before it plays out. Traders should exercise caution when using the PSAR around major economic events or crypto headlines, as price action becomes less technical and more reactive.
Final Thoughts: Is the Parabolic SAR a Valuable Tool for Crypto?
The Parabolic SAR remains one of the most user-friendly tools for identifying trend reversals, setting dynamic stop-loss levels, and spotting entry and exit points in the crypto market. Its visual simplicity, with flipping dots around the price, makes it accessible for beginners, while its adaptability suits more advanced strategies.
When used in strongly trending markets, the SAR provides high-quality signals that enable traders to ride momentum effectively. As demonstrated in the BTC/USDT examples, combining it with tools like the Relative Strength Index (RSI) or the Average Directional Index (ADX) significantly improves its reliability.
However, context matters. Traders should always analyze market structure and confirm the trend before acting on a SAR signal. The default settings (AF 0.02, Max AF 0.20) provide a good starting point, but experimenting with these values can help tailor the indicator to a specific coin or timeframe.
Ultimately, the Parabolic SAR is a valuable addition to any crypto trader’s toolbox. Still, it works best when used as part of a broader, multi-indicator strategy that considers market phase, trend strength, and real-time volatility.
For those trading on BingX, incorporating the Parabolic SAR into a multi-indicator strategy can offer the clarity and confidence needed to navigate volatile crypto markets effectively.
Related Reading
Frequently Asked Questions (FAQs) on Parabolic SAR
1. What is the Parabolic SAR indicator in crypto trading?
The Parabolic Stop and Reverse (SAR) is a trend-following technical indicator that appears as dots above or below price candles. It helps traders identify trend direction and potential reversals in the crypto market.
2. How does the Parabolic SAR generate buy or sell signals?
A buy signal occurs when the SAR dots flip below the price, indicating a bullish trend. A sell signal is triggered when dots move above the price, suggesting a bearish trend.
3. What are the best settings for the Parabolic SAR?
Most platforms, including BingX, use default settings of:
• Acceleration Factor (AF): 0.02
• AF Step: 0.02
• Maximum AF: 0.20
Traders often adjust these based on asset volatility and timeframe.
4. Is the Parabolic SAR accurate in all market conditions?
The SAR works best in trending markets. It can generate false signals during sideways or choppy markets, which is why it's often combined with the Relative Strength Index (RSI), Average Directional Index (ADX), or moving averages (MA) for confirmation.
5. Can I use Parabolic SAR for short-term and long-term trades?
Yes. For day trading, use lower timeframes like 15-min or 1-hour. For swing or position trading, 4-hour and daily charts offer more reliable signals.
6. How do I combine Parabolic SAR with other indicators?
• Relative Strength Index (RSI) confirms overbought/oversold conditions.
• Moving Averages confirm trend direction.
• Average Directional Index (ADX) validates trend strength.
This combination reduces false entries and improves accuracy.
7. What makes Parabolic SAR useful for crypto traders?
Its visual simplicity, dynamic stop-loss mechanism, and early trend reversal signals make it ideal for navigating volatile crypto assets like BTC or ETH.