เส้นแนวโน้มเป็นหนึ่งในเครื่องมือสำคัญที่ใช้ในการวิเคราะห์ทางเทคนิคเพื่อระบุทิศทางตลาดคริปโตและจุดกลับตัวที่อาจเกิดขึ้น เรียนรู้วิธีการวาด วิเคราะห์ และเทรดด้วยความมั่นใจโดยใช้กราฟราคา ระดับแนวรับและแนวต้าน และตัวบ่งชี้
หากคุณเคยดูกราฟราคาคริปโตและรู้สึกไม่แน่ใจว่าเกิดอะไรขึ้น เส้นแนวโน้มเป็นวิธีง่ายๆ ที่จะช่วยให้คุณเข้าใจสถานการณ์ได้ชัดเจนขึ้น เส้นแนวโน้มเป็นเพียงเส้นที่คุณลากผ่านจุดราคาต่างๆ เพื่อดูว่าตลาดกำลังมุ่งหน้าไปในทิศทางใด ไม่ว่าจะเป็นการขึ้น การลง หรือการเคลื่อนที่ด้านข้าง
ในการเทรดคริปโตเคอร์เรนซี เส้นแนวโน้มเป็นหนึ่งในเครื่องมือที่มีประโยชน์ที่สุดในการวิเคราะห์ทางเทคนิค ช่วยให้เทรดเดอร์เข้าใจแนวโน้มตลาดโดยรวม ระบุจุดกลับตัวที่อาจเกิดขึ้น และตัดสินใจเทรดได้อย่างมีข้อมูลมากขึ้น โดยอิงจากข้อมูลราคาจริง ไม่ใช่แค่การคาดเดา
แม้ว่าคุณจะยังใหม่กับการเทรด การเรียนรู้วิธีการวาดเส้นแนวโน้มจะช่วยให้คุณมองเห็นการเคลื่อนไหวของราคาได้ชัดเจนขึ้น และมีความมั่นใจในการตัดสินใจเทรดมากขึ้น
เส้นแนวโน้มคืออะไร?
เส้นแนวโน้มเป็นหนึ่งในเครื่องมือที่ใช้งานง่ายที่สุดสำหรับผู้เริ่มต้นในการวิเคราะห์ทางเทคนิค เป็นเส้นตรงที่เชื่อมต่อจุดราคาสำคัญบนกราฟ ซึ่งโดยปกติจะเป็นจุดสูงสุดหรือจุดต่ำสุด เพื่อแสดงทิศทางที่ตลาดกำลังมุ่งหน้าไป เส้นเหล่านี้ช่วยให้เทรดเดอร์เห็นภาพว่าตลาดกำลังมีแนวโน้มขาขึ้น ขาลง หรือเคลื่อนที่ด้านข้าง
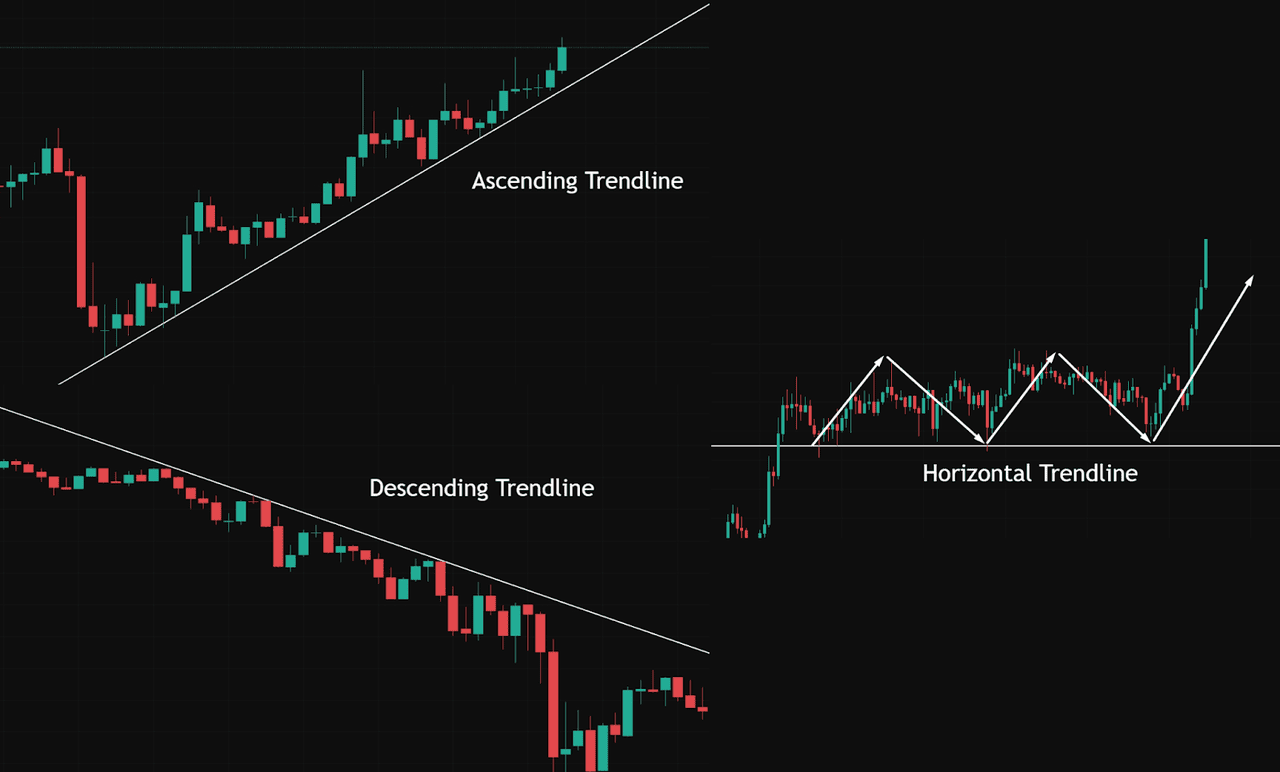
เส้นแนวโน้มหลักมีสามประเภท ดังแสดงในกราฟด้านล่าง:
• เส้นแนวโน้มขาขึ้น (Ascending trend line): ลากอยู่ใต้จุดต่ำสุดของราคาที่สูงขึ้น บ่งชี้ถึงแนวโน้มขาขึ้น (bullish trend) ที่มีโมเมนตัมขาขึ้นอย่างต่อเนื่อง
• เส้นแนวโน้มขาลง (Descending trend line): ลากอยู่เหนือจุดสูงสุดของราคาที่ต่ำลง สะท้อนถึงแนวโน้มขาลง (bearish trend) ซึ่งมักจะนำไปสู่การลดลงเพิ่มเติม
• เส้นแนวโน้มแนวนอน (Horizontal trend line): มักจะบ่งบอกถึงโซนแนวรับและแนวต้านที่ราคา cenderung (มีแนวโน้ม) ที่จะดีดกลับหรือถูกปฏิเสธ
เส้นเหล่านี้ช่วยให้เทรดเดอร์อ่านทิศทางตลาด ติดตามโมเมนตัม และคาดการณ์การกลับตัวของราคาได้อย่างง่ายดาย เมื่อใช้อย่างถูกต้อง จะสามารถช่วยนำทางในการตัดสินใจเข้าและออกจากการเทรดได้ดีขึ้น แม้ว่าคุณจะเพิ่งเริ่มต้นก็ตาม
วิธีการวาดเส้นแนวโน้มที่แม่นยำ
การวาดเส้นแนวโน้มเป็นหนึ่งในทักษะที่ใช้งานได้จริงที่สุดที่เทรดเดอร์คริปโตทุกคนควรเชี่ยวชาญ เส้นเหล่านี้ช่วยจัดระเบียบสิ่งที่มักจะดูวุ่นวายบนกราฟราคา ทำให้ง่ายต่อการระบุทิศทางโดยรวมของตลาด ไม่ว่าจะเป็นขาขึ้น ขาลง หรือเคลื่อนที่ในกรอบ
คู่มือการวาดเส้นแนวโน้มทีละขั้นตอน
1. ใช้ข้อมูลราคาในอดีต: เริ่มต้นด้วยการซูมออกเพื่อระบุจุดสูงสุด (peaks) และจุดต่ำสุด (dips) ของราคาที่ผ่านมา จุดเหล่านี้เป็นจุดราคาสำคัญที่โมเมนตัมของตลาดมีการเปลี่ยนแปลง
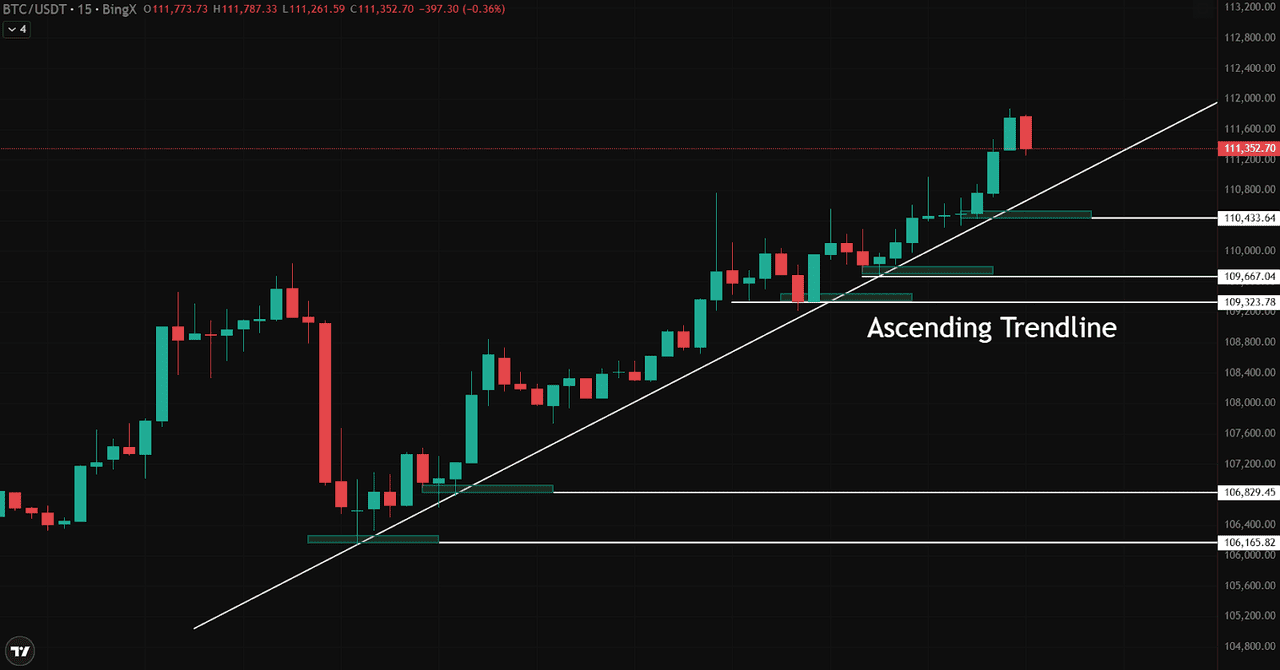
ตัวอย่างที่ 1: เส้นแนวโน้มขาขึ้น (BTC/USDT – กราฟ 15 นาทีบน BingX)
ในภาพด้านล่าง เราวาดเส้นแนวโน้มโดยการเชื่อมต่อจุดต่ำสุดที่สูงขึ้น ซึ่งแสดงถึงแนวโน้มขาขึ้น สังเกตว่าราคามีการเคารพเส้นนี้หลายครั้ง ซึ่งเป็นการยืนยันความถูกต้องของเส้น
เราเชื่อมต่อระดับเหล่านี้:
• จุดต่ำสุด 1: $106,165
• จุดต่ำสุด 2: $106,829
• จุดต่ำสุด 3: $109,323
• จุดต่ำสุด 4: $109,667
• จุดต่ำสุด 5: $110,433
ทุกครั้งที่ราคาสัมผัสเส้นแนวโน้มหรือโซนแนวรับใกล้เคียง ผู้ซื้อจะเข้ามาซื้อ ซึ่งเป็นการตอกย้ำทั้งทิศทางแนวโน้มและการมีอยู่ของระดับแนวรับและแนวต้าน
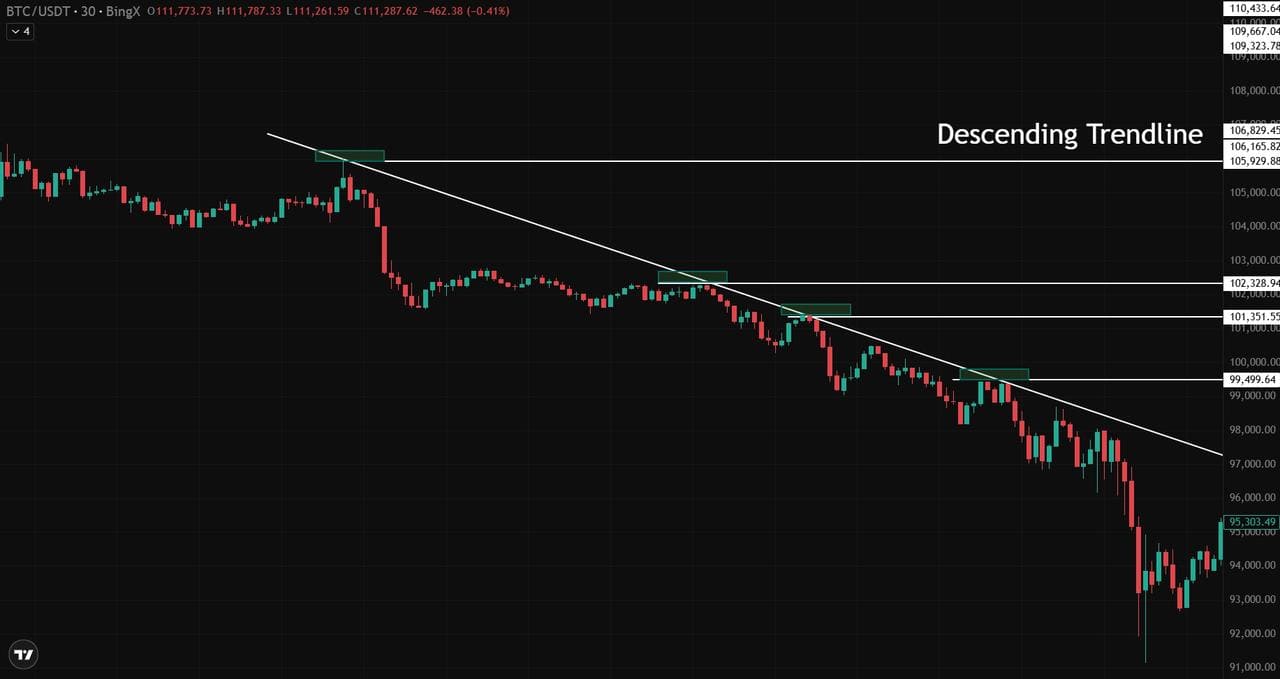
ตัวอย่างที่ 2: เส้นแนวโน้มขาลง – BTC/USDT (กราฟ 30 นาทีบน BingX)
ตอนนี้ เรามาดูเส้นแนวโน้มขาลง ซึ่งเชื่อมต่อจุดสูงสุดที่ต่ำลง และเน้นย้ำถึงแรงกดดันขาลง
จุดแนวต้านสำคัญ:
• จุดสูงสุด 1: $105,929.88
• จุดสูงสุด 2: $102,328.92
• จุดสูงสุด 3: $101,351.55
• จุดสูงสุด 4: $99,499.64
สังเกตว่าราคามักจะถูกปฏิเสธที่หรือใกล้เส้นนี้ซ้ำๆ ก่อนที่จะลดลงต่อไป ซึ่งเป็นสัญญาณคลาสสิกที่แสดงว่าผู้ขายกำลังควบคุมตลาด
2. เชื่อมต่อจุดราคาสำคัญ
• ในกราฟเส้นแนวโน้มขาขึ้นด้านล่าง (BTC/USDT 15 นาทีบน BingX) เส้นแนวโน้มเชื่อมต่อจุดต่ำสุดที่สูงขึ้นหลายจุด สิ่งนี้แสดงให้เห็นถึงแนวโน้มขาขึ้นที่แข็งแกร่งซึ่งผู้ซื้อเข้ามาซื้ออย่างต่อเนื่อง
• ในทางตรงกันข้าม เส้นแนวโน้มขาลง (BTC/USDT 30 นาทีบน BingX) เชื่อมต่อจุดสูงสุดที่ต่ำลง สิ่งนี้บ่งชี้ถึงโมเมนตัมขาลงและแรงกดดันในการขายที่เพิ่มขึ้น
3. รักษากราฟเส้นให้ตรงและเป็นธรรมชาติ
หากคุณต้องบังคับให้เส้นสัมผัสจุดต่างๆ มากขึ้น แสดงว่าไม่ใช่เส้นแนวโน้มที่ถูกต้อง ใช้ไส้เทียนหรือเนื้อเทียนก็ได้ แต่ต้องมีความสอดคล้องกัน
• ยืนยันในกรอบเวลาที่แตกต่างกัน
ตรวจสอบแนวโน้มในกรอบเวลาที่สูงขึ้นเสมอ (เช่น 1 ชั่วโมงเทียบกับ 4 ชั่วโมง) เพื่อหลีกเลี่ยงความมั่นใจที่ผิดพลาดในเส้นที่ไม่แข็งแรง
• สังเกตการสัมผัสซ้ำๆ
ยิ่งราคามีการเคารพเส้นแนวโน้มมากเท่าไหร่ เส้นนั้นก็จะยิ่งน่าเชื่อถือมากขึ้นเท่านั้น ซึ่งจะช่วยลดความเสี่ยงของสัญญาณที่ผิดพลาด
การตีความการทะลุเส้นแนวโน้ม
การทะลุเส้นแนวโน้มเป็นหนึ่งในสัญญาณที่ถูกจับตามองมากที่สุดในการวิเคราะห์ทางเทคนิค เมื่อราคาทะลุผ่านเส้นแนวโน้มที่ก่อตั้งขึ้นอย่างดี อาจบ่งชี้ถึงการกลับตัวของแนวโน้มหรือการเริ่มต้นของการเคลื่อนไหวในทิศทางใหม่ แต่ไม่ใช่ทุกการทะลุจะมีความหมาย ดังนั้นการเรียนรู้วิธียืนยันการทะลุที่ถูกต้องจึงเป็นสิ่งสำคัญ
จะเกิดอะไรขึ้นเมื่อราคาทะลุเส้นแนวโน้ม?
การทะลุเส้นแนวโน้มเกิดขึ้นเมื่อราคาปิดตัวลงอย่างเด็ดขาดเหนือ (หรือใต้) เส้นแนวโน้มที่เคยทำหน้าที่เป็นแนวรับหรือแนวต้าน สิ่งนี้อาจเป็นจุดเริ่มต้นของการทะลุ โดยเฉพาะอย่างยิ่งหากการเคลื่อนไหวได้รับการสนับสนุนจากโมเมนตัมและปริมาณการซื้อขายที่แข็งแกร่ง
อย่างไรก็ตาม การทะลุหลอกเป็นเรื่องปกติ สิ่งเหล่านี้เกิดขึ้นเมื่อราคาทะลุเส้นแนวโน้มเพียงชั่วครู่แต่กลับถอยกลับอย่างรวดเร็ว ซึ่งนำเทรดเดอร์จำนวนมากไปสู่กับดัก เพื่อลดโอกาสที่จะถูกหลอก ให้ใช้ตัวบ่งชี้ทางเทคนิคเพื่อยืนยันการเคลื่อนไหว
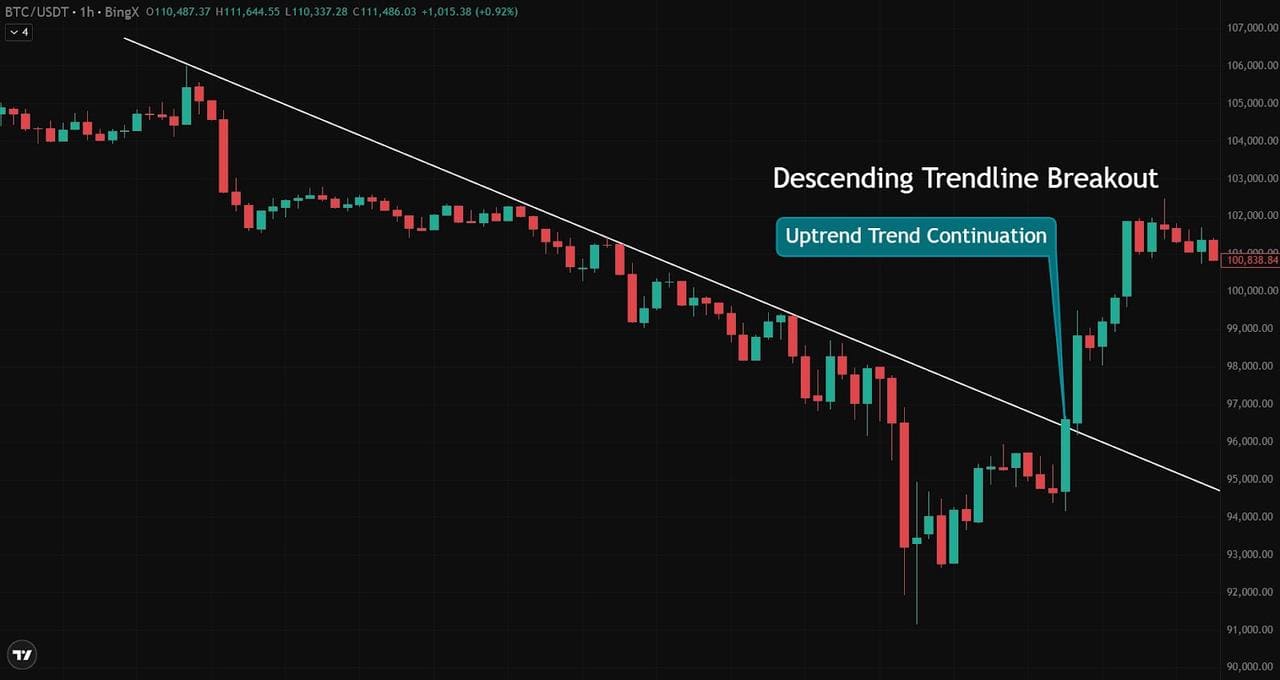
ตัวอย่าง: การทะลุเส้นแนวโน้มขาลง – BTC/USDT (กราฟ 1 ชั่วโมงบน BingX)
ในกราฟ Bitcoin ราย 1 ชั่วโมงด้านล่าง ราคาได้เคารพเส้นแนวโน้มขาลงมาหลายช่วงเวลา สิ่งนั้นเปลี่ยนไปที่ $96,600 เมื่อ BTC ทะลุเหนือเส้นแนวโน้มด้วย แท่งเทียนขาขึ้นที่แข็งแกร่ง การทะลุยังคงดำเนินต่อไป ดันราคาขึ้นไปสู่จุดสูงสุดที่ $102,000
ระดับราคาสำคัญ:
• แนวต้านเส้นแนวโน้ม: $96,600
• ราคาปิดแท่งเทียนยืนยันการทะลุ: $97,500
• จุดสูงสุดหลังการทะลุ: $102,000
การทะลุนี้ส่งสัญญาณถึงการกลับตัวที่อาจเกิดขึ้นจากแนวโน้มขาลงไปสู่แนวโน้มขาขึ้น
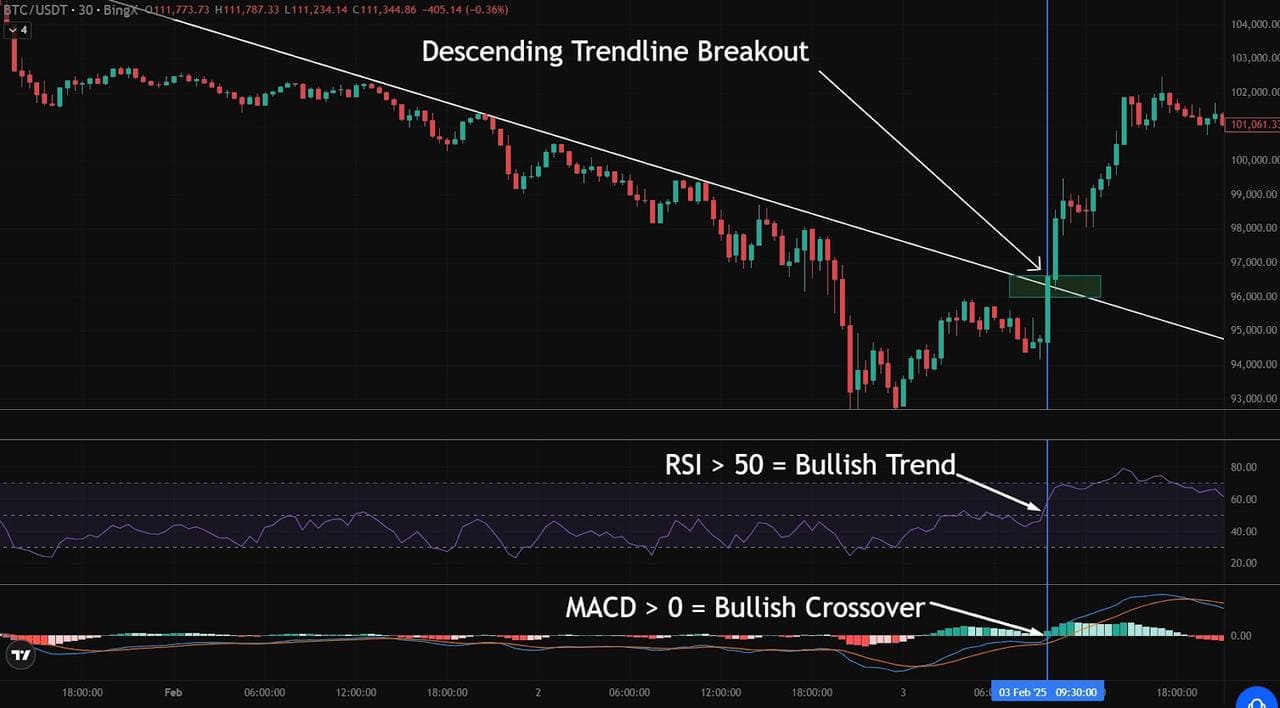
การยืนยันการทะลุด้วย RSI และ MACD
ในตัวอย่างที่สองนี้ เราใช้ตัวบ่งชี้ทางเทคนิคเพื่อยืนยันการทะลุ:
ตัวบ่งชี้เหล่านี้สอดคล้องกับการทะลุราคาที่ประมาณ $96,500–$97,000 ซึ่งช่วยเสริมความมั่นใจในการเปลี่ยนแปลงแนวโน้ม
ระดับการยืนยันตัวบ่งชี้สำคัญ:
• RSI ครอสโอเวอร์: 50+ (หลังจากราคาทะลุเส้นแนวโน้ม)
• MACD > 0 ใกล้ราคาปิดแท่งเทียนที่ $97,000
วิธีหลีกเลี่ยงสัญญาณหลอก
• รอให้แท่งเทียนปิดตัวเหนือเส้นแนวโน้มเสมอ ไม่ใช่แค่ไส้เทียน
• ยืนยันด้วยตัวบ่งชี้ทางเทคนิคที่สนับสนุนอย่างน้อยหนึ่งตัว เช่น RSI หรือ MACD
• สังเกตปริมาณการซื้อขายที่พุ่งสูงขึ้น ซึ่งมักจะมาพร้อมกับการทะลุที่แท้จริง
การใช้เส้นแนวโน้มร่วมกับเครื่องมืออื่นๆ ช่วยให้คุณแยกแยะสัญญาณรบกวนออกจากโอกาส และเพิ่มความสามารถในการเทรดด้วยความมั่นใจ
การใช้เส้นแนวโน้มเพื่อระบุรูปแบบกราฟ
เส้นแนวโน้มไม่ได้เพียงแค่แสดงทิศทางของแนวโน้มเท่านั้น แต่ยังช่วยให้เทรดเดอร์เห็นภาพรูปแบบกราฟที่สำคัญ ซึ่งสามารถส่งสัญญาณการเคลื่อนไหวครั้งใหญ่ครั้งต่อไปได้ รูปแบบต่างๆ เช่น สามเหลี่ยมและเวดจ์ จะระบุได้ง่ายขึ้นมากเมื่อจุดสูงสุดและจุดต่ำสุดที่สำคัญถูกเชื่อมต่อด้วยเส้นที่ชัดเจนและสอดคล้องกัน
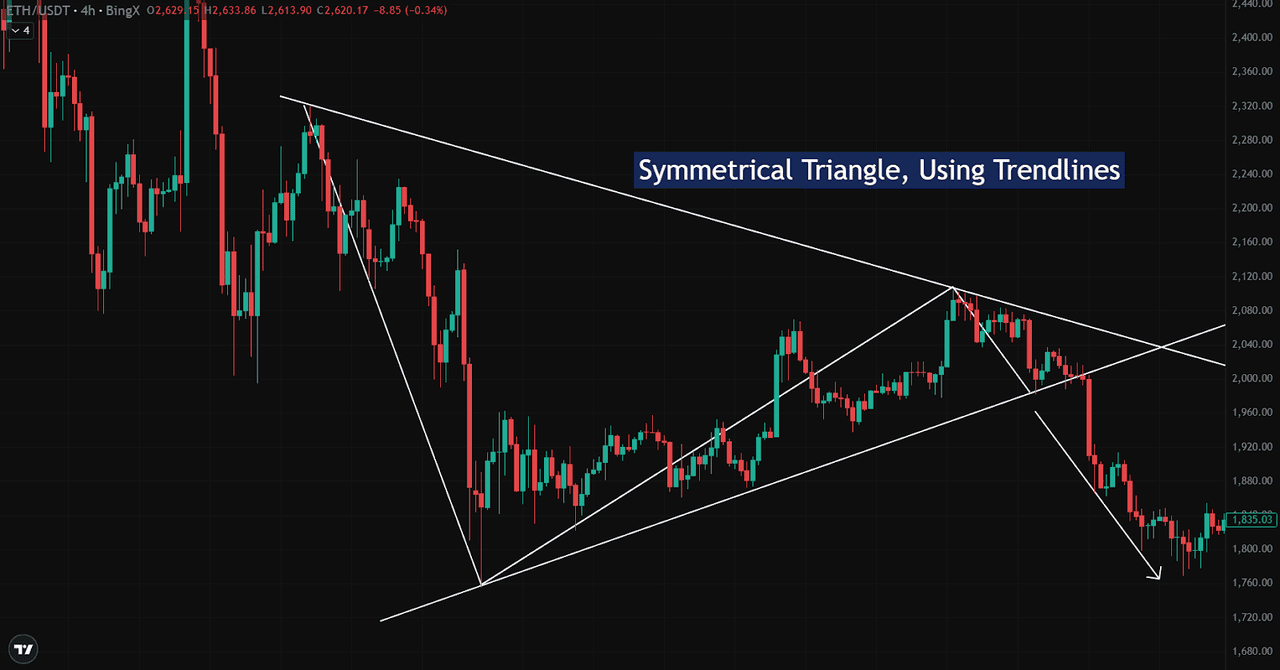
หนึ่งในการตั้งค่าที่พบบ่อยที่สุดคือสามเหลี่ยมสมมาตร (symmetrical triangle) ซึ่งชุดของจุดสูงสุดที่ต่ำลงและจุดต่ำสุดที่สูงขึ้นจะก่อตัวเป็นเส้นแนวโน้มสองเส้นที่มาบรรจบกัน สิ่งนี้บ่งชี้ถึงช่วงราคาที่แคบลง ซึ่งมักจะตามมาด้วยการทะลุ
ตัวอย่าง: สามเหลี่ยมสมมาตรบน ETH/USDT (กราฟ 4 ชั่วโมงบน BingX)
ในตัวอย่างข้างต้น ราคา
Ethereum แคบลงระหว่างเส้นแนวโน้มสองเส้น:
• แนวต้านขาลงจากประมาณ $2,280
• แนวรับขาขึ้นจาก $1,560
เมื่อราคาเข้าใกล้จุดยอด ความผันผวนจะลดลง จนกระทั่งในที่สุดก็ทะลุเส้นแนวโน้มด้านล่างใกล้ $1,960 ซึ่งกระตุ้นให้เกิดการเคลื่อนไหวลงอย่างรวดเร็วไปสู่ $1,835
การจดจำรูปแบบลักษณะนี้ ซึ่งทำได้โดยใช้เส้นแนวโน้มเพียงอย่างเดียว ช่วยให้เทรดเดอร์สามารถระบุการตั้งค่าการเทรดล่วงหน้า คาดการณ์การเคลื่อนไหวของราคา และเตรียมการเข้าหรือออกจากการเทรดด้วยความมั่นใจที่มากขึ้น
การกำหนดจุดเข้าและออกโดยใช้เส้นแนวโน้ม
เมื่อคุณระบุเส้นแนวโน้มที่น่าเชื่อถือได้แล้ว ขั้นตอนต่อไปคือการรู้ว่าเมื่อใดควรดำเนินการ เส้นแนวโน้มช่วยกำหนดทั้งจุดเข้าและจุดออก ในขณะเดียวกันก็เป็นแนวทางในการจัดการความเสี่ยงของคุณผ่านโซนแนวรับและแนวต้านที่กำหนดไว้อย่างชัดเจน
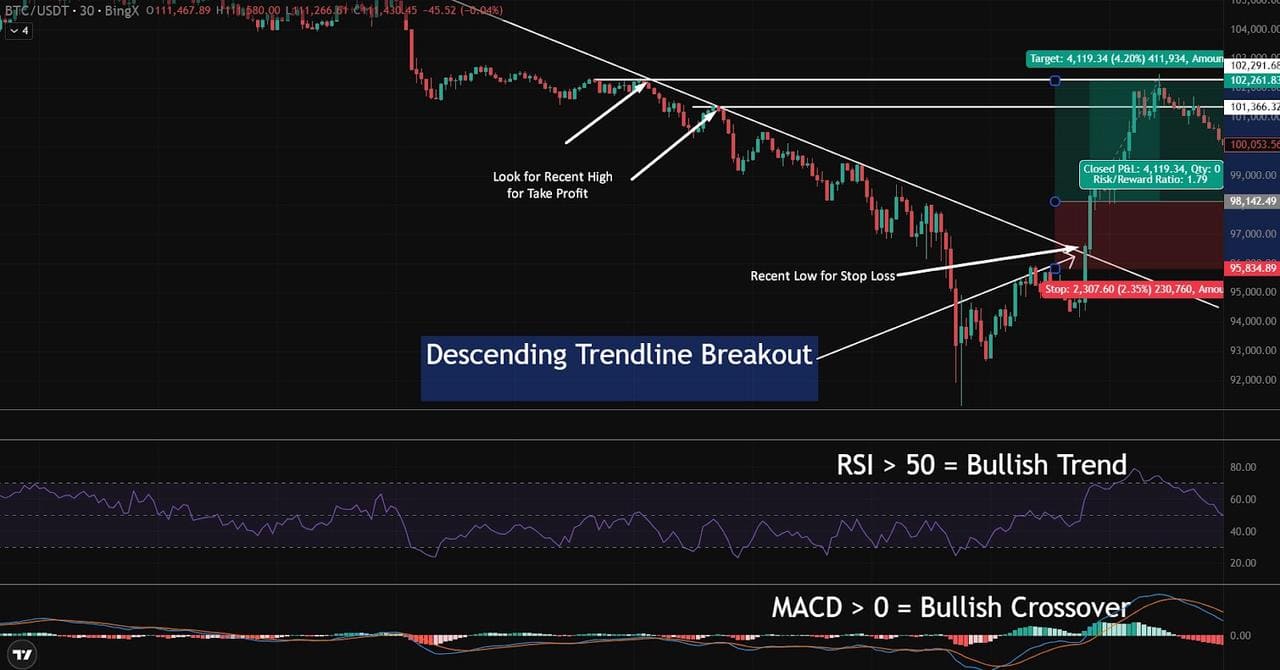
ตัวอย่าง: การเทรดแบบทะลุของ BTC/USDT – กราฟ 30 นาทีบน BingX
ในตัวอย่างข้างต้น
Bitcoin ทะลุออกจากเส้นแนวโน้มขาลงที่กำหนดไว้อย่างชัดเจนที่ $97,000 ซึ่งเสนอโอกาสในการเข้าซื้อ (long entry) ที่เป็นไปได้
• จุดเข้า: แท่งเทียนทะลุขาขึ้นเหนือเส้นแนวโน้มที่ประมาณ $97,000–$98,000
• จุดตัดขาดทุน (Stop-Loss): กำหนดไว้ต่ำกว่าจุดต่ำสุดล่าสุดที่ $95,834.89 เพื่อจำกัดความเสี่ยงขาลง
• เป้าหมายทำกำไร (Take-Profit Target): วางไว้ใกล้ระดับแนวต้านถัดไปที่ $102,291.68 โดยอิงจากจุดสูงสุดก่อนหน้า
การตั้งค่านี้มีโครงสร้างที่ชัดเจน:
• เข้าเมื่อยืนยันการทะลุ
• ออกที่โซนแนวต้านที่สมเหตุสมผล
เคล็ดลับการบริหารความเสี่ยงที่สำคัญ:
• กำหนดจุดตัดขาดทุนของคุณเสมอก่อนเข้าเทรด เพื่อป้องกันการออกจากการเทรดด้วยอารมณ์
• ใช้ระดับแนวรับเป็นแนวป้องกันความเสี่ยงขาลง
• กำหนดเป้าหมาย
ทำกำไร โดยอิงจากจุดสูงสุดล่าสุด หรือพื้นที่ที่ราคาเคยประสบปัญหา (โซนแนวต้าน)
การใช้เส้นแนวโน้มในลักษณะนี้ช่วยให้เทรดเดอร์มีกรอบการทำงานที่มองเห็นได้และอิงตามกฎเพื่อเข้าถึงการเทรดทุกครั้ง ไม่ว่าคุณจะเทรดสั้น (scalping) การเคลื่อนไหวระยะสั้น หรือเทรดสวิง (swing trading) แนวโน้มระยะยาว
การผสานรวมเส้นแนวโน้มกับเครื่องมือวิเคราะห์ทางเทคนิคอื่นๆ
เส้นแนวโน้มให้โครงสร้าง แต่การพึ่งพาเส้นแนวโน้มเพียงอย่างเดียวอาจนำไปสู่การพลาดหรือการเทรดที่ผิดจังหวะ การรวมเส้นแนวโน้มเข้ากับเครื่องมือวิเคราะห์ทางเทคนิคอื่นๆ ช่วยยืนยันการทะลุ หลีกเลี่ยงสัญญาณหลอก และเสริมสร้างกลยุทธ์ของคุณ
ในตัวอย่างการทะลุของ BTC/USDT ข้างต้น การวิเคราะห์เส้นแนวโน้มได้รับการสนับสนุนโดย:
• ปริมาณการซื้อขาย – ปริมาณการซื้อขายพุ่งสูงขึ้นในแท่งเทียนทะลุที่ประมาณ $97,000 ซึ่งยืนยันการเคลื่อนไหวด้วยความเชื่อมั่นที่เพิ่มขึ้น
ทำไมจึงสำคัญ:
• เส้นแนวโน้มแสดงให้เห็นว่าตลาดกำลังเคลื่อนที่ไปในทิศทางใด
• ตัวบ่งชี้แสดงให้เห็นว่าการเคลื่อนไหวนั้นแข็งแกร่งเพียงใด
• เมื่อรวมกันแล้ว จะช่วยให้เทรดเดอร์มีการตั้งค่าการเทรดที่น่าเชื่อถือและอิงข้อมูลมากขึ้น
ตรวจสอบสัญญาณข้ามกันเสมอ แทนที่จะพึ่งพาเครื่องมือเดียว โดยเฉพาะอย่างยิ่งในตลาดคริปโตที่เคลื่อนไหวรวดเร็ว
สรุป: เส้นแนวโน้มในฐานะกลยุทธ์การเทรดหลัก
การใช้เส้นแนวโน้มเป็นหนึ่งในวิธีที่ใช้งานได้จริงและเป็นมิตรกับผู้เริ่มต้นมากที่สุดในการทำความเข้าใจทิศทางตลาด จัดการการเทรด และลดการตัดสินใจที่ใช้อารมณ์ ไม่ว่าคุณจะกำลังมองหาการทะลุ วาดระดับแนวรับ หรือระบุรูปแบบกราฟ เส้นแนวโน้มจะให้โครงสร้างแก่การเคลื่อนไหวของราคาที่ผันผวน
แต่เพื่อการเทรดด้วยความมั่นใจ สิ่งสำคัญคือต้องก้าวข้ามเส้นแนวโน้มไปอีกขั้น การรวมเส้นแนวโน้มเข้ากับตัวบ่งชี้ทางเทคนิค ข้อมูลในอดีต และแนวโน้มตลาดแบบเรียลไทม์ ช่วยให้ตัดสินใจเทรดได้อย่างมีข้อมูลมากขึ้น ซึ่งปรับให้เข้ากับสถานการณ์ทางการเงินเฉพาะของคุณ
แนวทางแบบบูรณาการนี้ไม่เพียงแต่ช่วยให้คุณกำหนดเวลาเข้าและออกเท่านั้น แต่ยังช่วยให้เทรดเดอร์มีความสอดคล้องกันและปรับตัวได้เมื่อตลาดมีการเปลี่ยนแปลง
คำถามที่พบบ่อย (FAQ)
1. เส้นแนวโน้มมีความน่าเชื่อถือในการคาดการณ์การเคลื่อนไหวของตลาดหรือไม่?
ใช่ แต่ต้องใช้ด้วยความระมัดระวัง ในตลาดที่มีความผันผวนสูง เส้นแนวโน้มยังคงสามารถเน้นทิศทางแนวโน้มโดยรวมได้ แต่การทะลุหลอกนั้นพบบ่อยกว่า นั่นคือเหตุผลว่าทำไมจึงควรใช้เส้นแนวโน้มร่วมกับตัวบ่งชี้ทางเทคนิค เช่น ปริมาณการซื้อขาย, RSI หรือ MACD เพื่อยืนยันก่อนเข้าเทรด
2. ควรกราฟเส้นแนวโน้มบนไส้เทียนหรือราคาปิดของแท่งเทียน?
ทั้งสองวิธีใช้ได้ผล แต่ความสอดคล้องเป็นสิ่งสำคัญ เทรดเดอร์บางคนชอบใช้ไส้เทียนเพื่อจับช่วงการเคลื่อนไหวของราคาเต็มรูปแบบ ในขณะที่บางคนใช้เนื้อเทียนเพื่อให้ได้โครงสร้างที่ชัดเจนกว่า เลือกแนวทางใดแนวทางหนึ่งและยึดติดกับมันตลอดการวิเคราะห์ของคุณ
3. กรอบเวลาใดที่เหมาะสมที่สุดสำหรับการวิเคราะห์เส้นแนวโน้ม?
ขึ้นอยู่กับสไตล์การเทรดของคุณ
• Scalpers อาจใช้กราฟ 1–15 นาที
• Swing traders นิยมใช้กราฟ 1 ชั่วโมงถึง 4 ชั่วโมง
• Position traders ดูกราฟรายวันหรือรายสัปดาห์
สำหรับการตั้งค่าที่น่าเชื่อถือ ควรตรวจสอบกรอบเวลาหลายๆ กรอบเสมอ เพื่อยืนยันความแข็งแกร่งของเส้นแนวโน้ม
4. สามารถใช้เส้นแนวโน้มได้ในทุกกรอบเวลาหรือไม่?
ใช่ เส้นแนวโน้มมีความหลากหลายและสามารถนำไปใช้ได้ในทุกกรอบเวลา ไม่ว่าคุณจะเทรดบนกราฟ 1 นาที หรือวิเคราะห์การเคลื่อนไหวของราคารายสัปดาห์ สิ่งที่เปลี่ยนไปไม่ใช่ตัวเครื่องมือเอง แต่เป็นประเภทของข้อมูลเชิงลึกที่ได้รับ
• ในกรอบเวลาที่ต่ำกว่า (เช่น 1–15 นาที) เส้นแนวโน้มช่วยระบุการเปลี่ยนแปลงโมเมนตัมระยะสั้นและการตั้งค่าที่เหมาะกับการเทรดสั้น
• ในกรอบเวลาที่สูงขึ้น (เช่น 1 วัน หรือ 1 สัปดาห์) จะเน้นโครงสร้างตลาดที่กว้างขึ้นและทิศทางแนวโน้มระยะยาว
ไม่ว่าจะเป็นกรอบเวลาใด เส้นแนวโน้มยังคงมีประโยชน์ในการระบุแนวรับ/แนวต้าน การทะลุ และการกลับตัวของแนวโน้ม สิ่งสำคัญคือต้องตีความเส้นแนวโน้มในบริบทของกรอบเวลาที่คุณกำลังเทรดเสมอ และยืนยันด้วยการวิเคราะห์หลายกรอบเวลาเมื่อทำได้
5. เส้นแนวโน้มแตกต่างจากช่องราคาอย่างไร?
เส้นแนวโน้มเชื่อมต่อจุดสูงสุดหรือจุดต่ำสุดเพื่อแสดงทิศทางโดยรวมของตลาด โดยให้ขอบเขตเดียวสำหรับการเคลื่อนไหวของราคา ไม่ว่าจะเป็นแนวรับ (ในแนวโน้มขาขึ้น) หรือแนวต้าน (ในแนวโน้มขาลง)
ในทางกลับกัน ช่องราคาประกอบด้วยเส้นแนวโน้มสองเส้นที่ขนานกัน:
• เส้นหนึ่งเชื่อมต่อจุดสูงสุด (แนวต้าน)
• อีกเส้นหนึ่งเชื่อมต่อจุดต่ำสุด (แนวรับ)
ช่องราคาจะสร้างช่วงราคาที่กำหนดไว้ ซึ่งเทรดเดอร์สามารถมองหาโอกาสในการเทรดได้หลายครั้ง โดยการซื้อใกล้เส้นล่างและขายใกล้เส้นบน ลองนึกภาพช่องราคาว่าเป็นเส้นแนวโน้มที่มีขอบเขตบนและล่าง
บทความที่เกี่ยวข้อง
 ที่มา: กราฟเทรด BTC/USDT บน BingX
  ที่มา: กราฟเทรด BTC/USDT บน BingX
  ที่มา: กราฟเทรด BTC/USDT บน BingX
  ที่มา: กราฟเทรด BTC/USDT บน BingX
  ที่มา: กราฟเทรด BTC/USDT บน BingX
  ที่มา: กราฟเทรด ETH/USDT บน BingX
  ที่มา: กราฟเทรด BTC/USDT บน BingX

