Not every price move in crypto is worth trading. Some look like breakouts but quickly fade, while others quietly gain momentum and take off without warning. Many traders struggle to tell the difference between a real trend and short-term noise.
What’s often missing is a reliable way to measure the strength behind a move. This is where the ADX indicator becomes useful.
In the next section, we’ll break down what the Average Directional Index (ADX) does, how to read it, and how it can help you filter out weak setups and trade with more confidence in volatile crypto markets.
How the ADX Indicator Measures Trend Strength
The Average Directional Index (ADX) is a technical indicator that measures trend strength on a scale from 0 to 100. It does not indicate trend direction, only how strong or weak a trend is.
• ADX below 20: The market is likely in a sideways or choppy phase, with little trend momentum
• ADX rising above 25: A strong trend is developing
• ADX around 40: Indicates a very strong trend
• ADX above 50: Signals an extremely strong trend, though it may also be nearing exhaustion
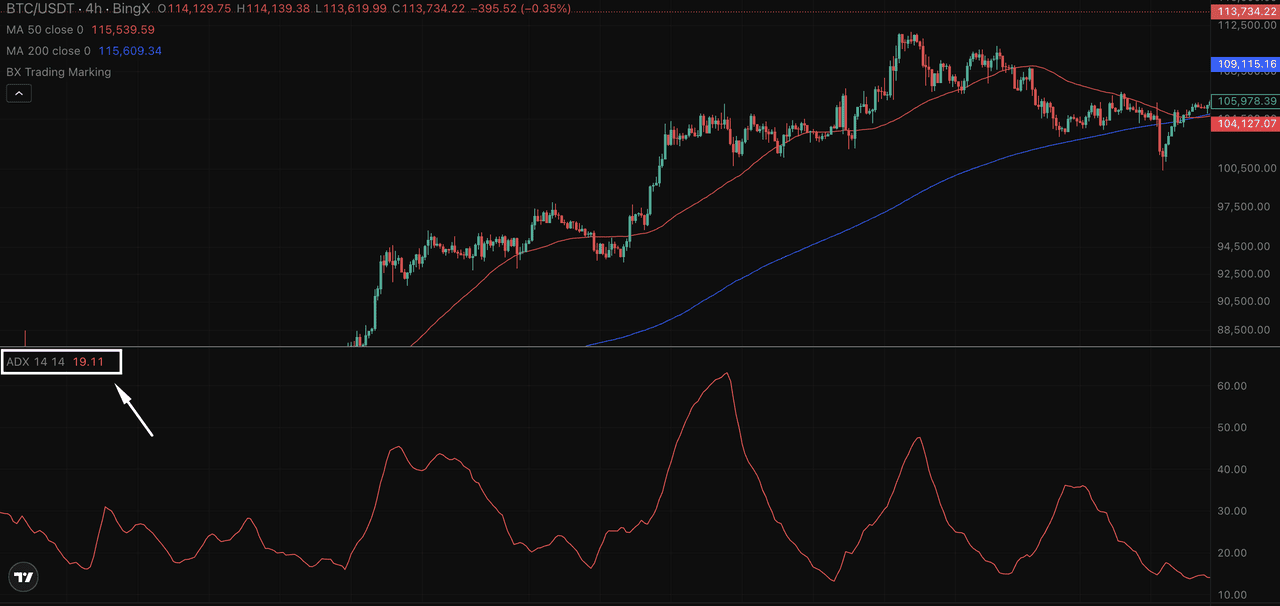
Source: BTC/USDT Trading Chart | BingX
When the ADX line climbs, it shows that trend momentum is picking up, whether the price is moving up or down. If the ADX remains low, it suggests weak price movement or indecision.
Understanding this difference between trend strength and price direction helps traders filter out noise and stay focused on setups with real conviction.
How to Interpret ADX Values in Crypto Markets
In crypto trading, the ADX indicator is valuable for answering one key question: Is the market trending strongly or not worth trading right now? Rather than guessing, traders use ADX values to measure the strength of a trend with clarity.
Let’s look at a real-world BTC/USDT 4-hour chart from BingX.
In the first half of the chart, Bitcoin’s price begins rising sharply from around $107,500 to above $121,000. As this rally unfolds, the ADX line climbs above 40, signaling a very strong trend. This tells traders the move is likely to continue, and entering a trend-following setup could have strong potential.
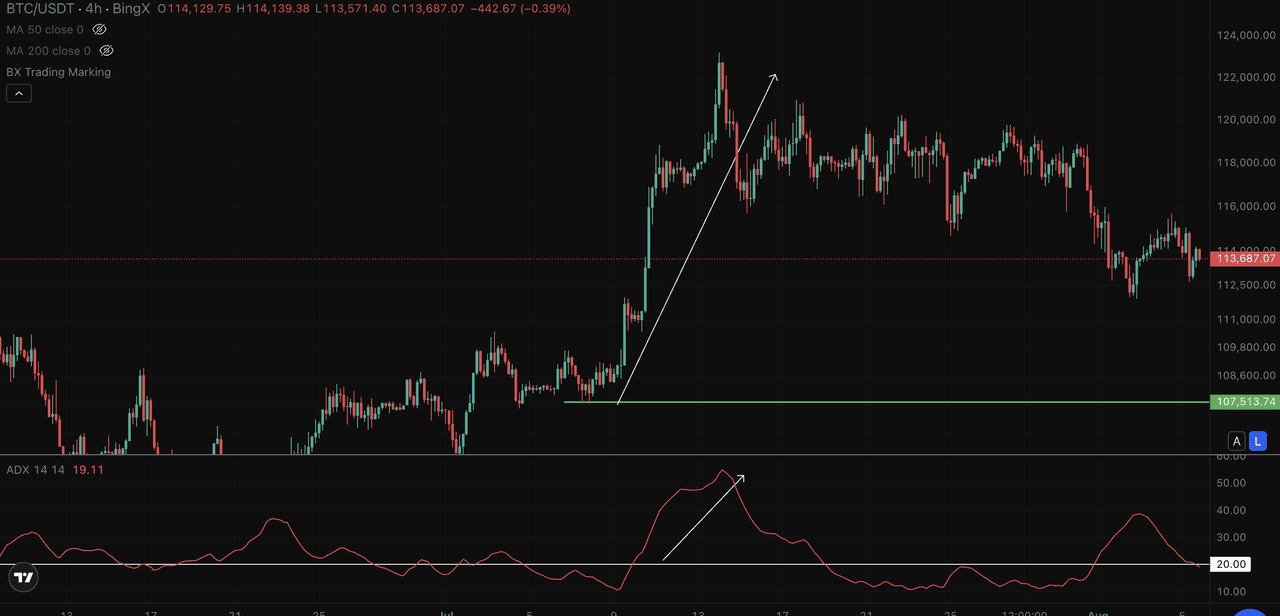
BTC/USDT (4H) – ADX rises above 40 during strong rally, then fades as price stalls
Later, the ADX peaks and begins to decline, even as the price continues to hover sideways. When the ADX falls below 25, it warns that trend momentum is weakening, and new breakout entries may lack conviction.
Quick ADX Thresholds
• Below 20 = weak or sideways market
• 25–40 = strong trend building
• Above 40–50 = extremely strong trend, but may be nearing exhaustion
Using ADX Indicator Across Multiple Timeframes
Using the ADX indicator across multiple time frames can improve your trade timing. A rising ADX on the daily chart is ideal for spotting longer-term swing trades, while a 4-hour or 1-hour ADX is better suited for short-term trading strategies like scalping or intraday momentum plays.
So, which timeframe is best?
It depends on your trading style:
• Daily chart ADX: Best for trend-following swing traders
• 4H chart ADX: Balanced for short-term trades with structure
• 1H or lower: Best for quick entries, but more prone to false signals
By watching how the ADX rises, flattens, or drops on your chosen timeframe, you can avoid weak setups, reduce noise, and build confidence in your entries when the trend shows real momentum.
Top Trading Strategies Using the ADX Indicator
The ADX indicator becomes most powerful when paired with other tools to build a complete strategy. Since the ADX only measures trend strength, traders often combine it with RSI and moving averages to time entries and exits with greater confidence.
1. ADX + RSI: Breakout Confirmation Strategy
In crypto trading, combining the ADX indicator with the Relative Strength Index (RSI) can help confirm whether a breakout has real strength behind it, or if it’s likely to fail. ADX measures trend strength, while RSI captures momentum. When both align, the probability of a successful trade improves significantly.
In this BTC/USDT 4-hour chart, Bitcoin breaks above a key resistance level near $110,650. Instead of entering immediately, smart traders wait for two confirming signals.
• First, the ADX rises from below 20 into the 25–40 zone, signaling that trend momentum is building.
• Then, the RSI climbs above 50, showing bullish pressure is increasing.
This alignment validates a long entry. The price moves sharply higher, eventually topping near $122,213. As the RSI enters the overbought zone (above 70) and ADX begins to flatten, it signals weakening momentum, making it a logical take-profit area.
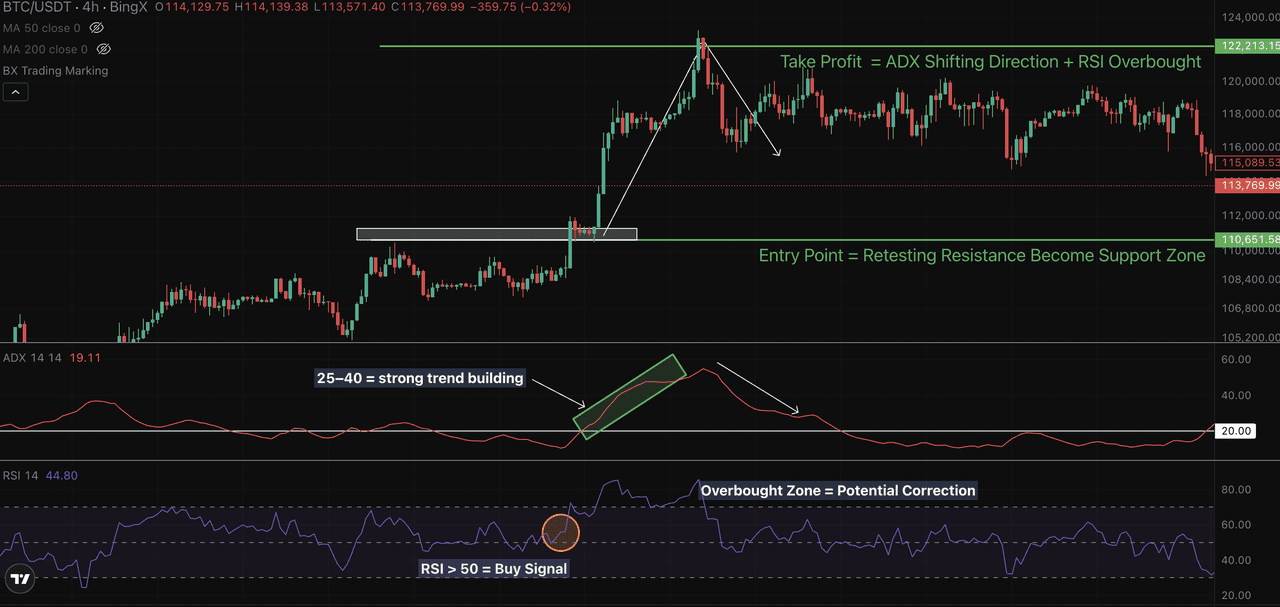
BTC/USDT (4H) – ADX and RSI align during a breakout, confirming strong upside
Trade summary:
• Entry: Breakout retest around $110,650 with ADX rising and RSI > 50
• Exit: Near $122,200 as RSI peaks and ADX flattens
• Stop-loss: Below breakout candle or prior support
• Signal confluence: ADX confirms trend strength; RSI confirms momentum
For short trades, the same logic applies in reverse. Look for breakdowns below support, a rising ADX above 25, and RSI falling below 50.
This setup helps filter out weak breakouts, ensures your entries align with trend momentum, and gives clearer exit signals based on trend exhaustion.
2. ADX + Moving Average Pullback Strategy
This strategy is designed for trending markets, where traders look to enter a move on a retracement rather than chasing a breakout. The ADX indicator confirms that a trend is active, while the 50-period moving average offers a dynamic level to watch for reentry.
In the BTC/USDT 4-hour chart above, Bitcoin initially moved sideways before breaking out with strong momentum. As price surged past $110,650, the ADX climbed from below 20 to over 30, indicating that a strong trend was building.
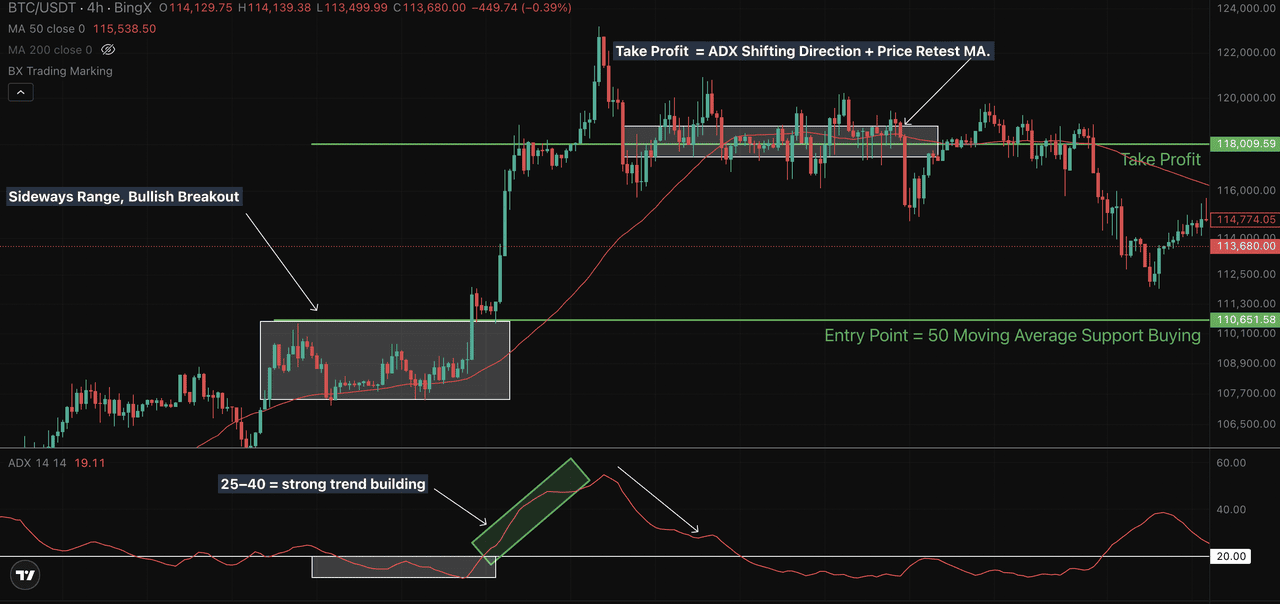
BTC/USDT (4H) – Pullback to 50 MA with rising ADX confirms continuation entry
Rather than entering at the top, a better opportunity came as price pulled back to the 50 MA, which was held as support. A bullish candle formed right at the moving average, creating a favorable long entry point backed by a still-rising ADX.
The uptrend continued until the ADX began to flatten and price struggled to stay above the moving average. This shift signaled trend exhaustion, and traders who entered earlier could look to exit near $118,000.
Strategy summary:
• An ADX reading above 25 confirms the presence of a valid trend.
• Pullback to the 50 MA offers a low-risk entry
• Entry on bullish candle confirmation at the MA
• Exit when ADX flattens or price weakens at the MA
This approach helps traders enter strong trends at better prices, using objective tools to reduce guesswork and avoid emotional decision-making.
3. Exit Strategy: Watch for ADX Reversal
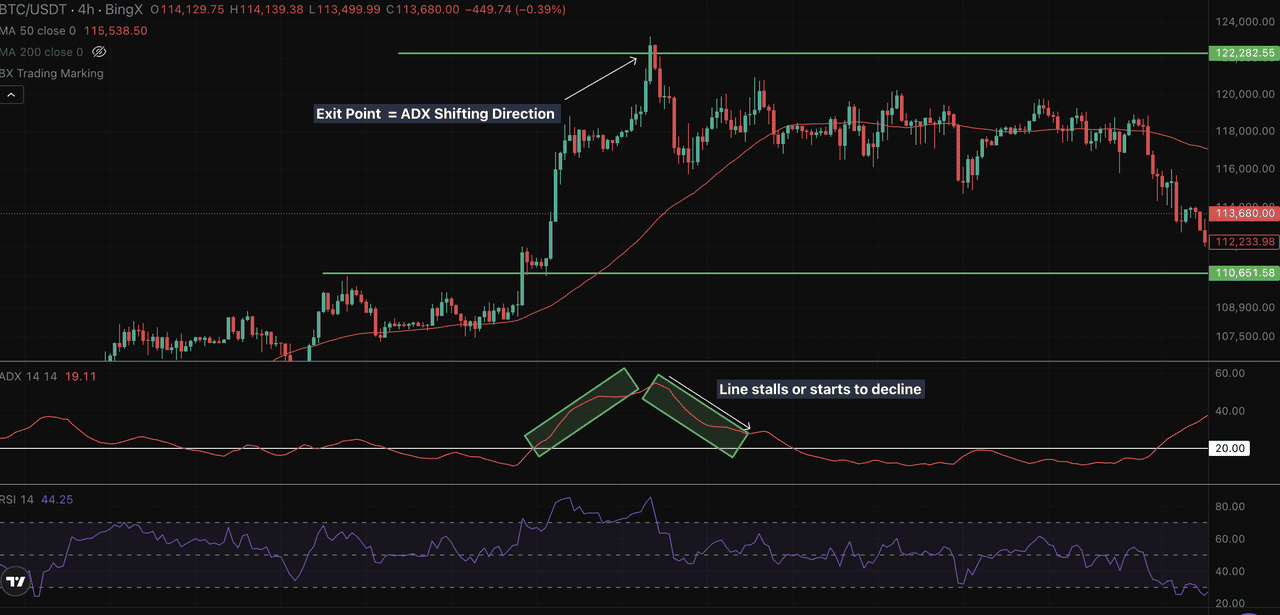
ADX is also useful for timing exits before momentum fades. When the ADX line peaks and begins to slope downward, it signals that the trend is losing strength, even if price hasn’t reversed yet. This decline often precedes consolidation or a pullback, especially after an extended move. For added confirmation, traders watch for bearish RSI divergence, lower highs, or failure to break resistance.
In this BTC/USDT 4-hour example, Bitcoin surged from the $110,650 support zone to a peak of around $122,280. The ADX line climbed above 35, confirming trend strength. But once ADX flattened and turned down, despite the price holding above $120,000, it warned that the bullish push was likely exhausted.
The RSI also fell from the overbought zone (above 70) to below 50, signaling a momentum shift. This was the perfect zone to take profit, protecting gains before the drop back to $113,700.
Exit checklist:
• ADX stalls near 35–40 and begins to decline
• RSI slips from 70 toward 50 or shows bearish divergence
• Price fails to break or hold above resistance ($122,280 in this case)
By tracking these signals together, traders can exit near the top of the move instead of reacting late to a reversal.
How to Combine ADX with Other Technical Indicators
ADX works well with RSI and moving averages, but it’s also effective when combined with other tools like moving average convergence divergence (MACD) or Parabolic SAR. These combinations help confirm trend strength, refine entries, and manage exits more efficiently.
For example, ADX shows trend momentum, RSI reveals overbought/oversold conditions, and moving averages highlight dynamic support or resistance. Using ADX alongside multiple indicators can improve accuracy and reduce false signals, especially in choppy markets.
Multi-indicator confirmation tips:
• Use RSI for overbought/oversold context
• Use moving averages (MAs) for trend direction and pullback entries
• Use Parabolic SAR to trail stop losses effectively
• Avoid trend trades when ADX < 20 and price is sideways
By blending ADX with complementary tools, traders can adapt strategies to different market environments and filter out low-probability signals more effectively.
ADX Limitations and How to Avoid False Signals
Like many technical indicators, the ADX has its limitations. It is a lagging indicator, meaning it often reacts after a trend has already begun, which can lead to late entries. In sideways or range-bound markets, ADX values can remain low even during sharp price movements, making it harder to gauge momentum.
Traders may also misread trend direction by relying solely on DI crossovers, especially without ADX rising past the 25 threshold.
To avoid false signals, it's essential to use ADX with other tools like volume analysis, moving averages, or RSI to confirm the strength and context of a trend before entering a trade.
Conclusion: Using ADX for Smarter Crypto Trades
The ADX indicator is best used as a trend strength filter, not a standalone signal. It helps traders avoid weak, indecisive markets and focus only on setups where momentum is building. Whether you’re trading breakouts, pullbacks, or momentum swings, ADX adds clarity by confirming whether a trend has the strength to continue.
To use it effectively, always pair ADX with a clear trading strategy and risk management plan. Combine it with indicators like RSI or moving averages to validate direction, and wait for ADX to rise above key thresholds before entering trend-based trades.
Ultimately, the ADX helps traders cut through market noise, stay objective, and reduce emotional decision-making, three essentials for consistency in crypto trading.
Related Articles
4. Simple Moving Average(SMA) vs Exponential Moving Average(EMA) in Crypto Trading: Differences to Know
FAQs on Using ADX Indicator in Crypto Trading
1. What’s the best ADX setting for crypto trading?
The most commonly used setting is a 14-period Average Directional Index, which offers a good balance between responsiveness and reliability. It works well across multiple time frames, including hourly and daily charts.
2. Can ADX be used for day trading or just long-term trends?
Yes, the Average Directional Index can be used for both. Day traders often apply it to 1-hour or 4-hour charts to spot short-term momentum, while swing traders use it on daily charts to identify longer-term trends.
3. What is the default ADX period and should I change it?
The default setting is 14 periods, and it suits most trading styles. However, experienced traders sometimes adjust it to 10 or 20 depending on how quickly they want the indicator to respond to changes in trend strength.
4. Is a rising ADX always a signal to enter a trade?
Not by itself. A rising Average Directional Index shows that trend strength is increasing, but it should be confirmed with other tools like price structure, Relative Strength Index (RSI), volume, or moving averages before placing a trade.
5. What pairs or coins does ADX work best on?
The indicator is most effective on high-liquidity pairs such as Bitcoin (BTC/USDT), Ethereum (ETH/USDT), and major altcoins. These assets provide smoother trends and more reliable signals.