In fast-moving crypto markets, traders often notice that lagging indicators react after the move has already happened. That’s why so many rely on price action, especially the pin bar candlestick pattern, one of the clearest ways to see rejection, a shift in sentiment, and a failed push in the dominant direction all within a single candle.
Pin bars appear across Bitcoin, Ethereum, and altcoins, and they work reliably on daily, weekly, and intraday charts. When they form at key levels, they often highlight moments where the market attempted a breakout but snapped back instantly, creating high-probability reversal or continuation setups.
In this guide, we break down what a pin bar is, how to identify bullish and bearish versions, how to trade them with confirmation, and how to combine them with other technical tools for higher accuracy.
What Is a Pin Bar Candlestick Pattern?
A pin bar candlestick pattern is a single-candle price action signal known for its small body and a long wick (tail). The long wick shows where price tried to move but was sharply rejected, while the small body reflects where price finally closed. This rejection is what makes pin bars powerful reversal signals in crypto trading.
When the pin bar’s wick is long, it means buyers or sellers failed to push price in that direction. The market quickly reversed, showing a shift in sentiment and a possible turning point.
Anatomy of a Pin Bar
• Long upper wick: Signals a bearish pin bar, showing strong selling pressure.
• Long lower wick: Signals a bullish pin bar, showing strong buying interest.
• Small real body: Located near one end of the candle.
• Close opposite the wick: Confirms rejection in the wick’s direction.
Not All Pin Bars Are Valid
A pin bar is only meaningful when it forms key support, key resistance, or in the direction of the dominant trend. Random pin bars in the middle of noise should be ignored.
Pin Bar vs. Inside Bar
A pin bar and an inside bar may look similar at first glance, but they communicate completely different market conditions.
Pin Bar: A pin bar shows rejection, meaning price attempted to move strongly in one direction but was forcefully pushed back. This creates the signature long wick. It signals a sharp shift in sentiment and often marks the beginning of a reversal.
Inside Bar: An inside bar, on the other hand, shows consolidation. The entire candle forms within the range of the previous candle, meaning volatility has dropped and neither buyers nor sellers are in control. Inside bars typically signal indecision, not reversal.
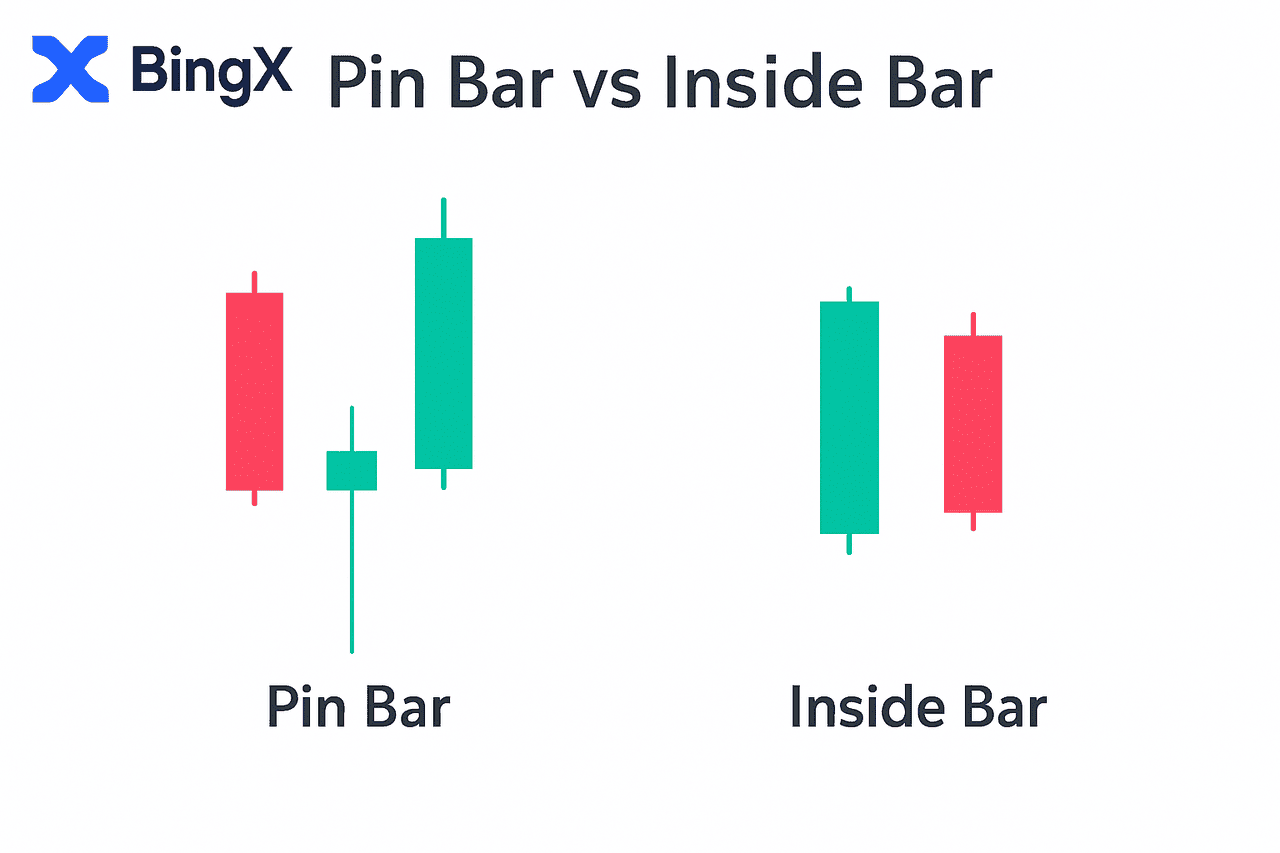
Understanding this difference helps traders avoid false signals. Pin bars highlight areas where the market attempted to break but failed, while inside bars simply show that the market is pausing. This distinction is critical for identifying real reversal opportunities instead of trading quiet, low-volatility conditions.
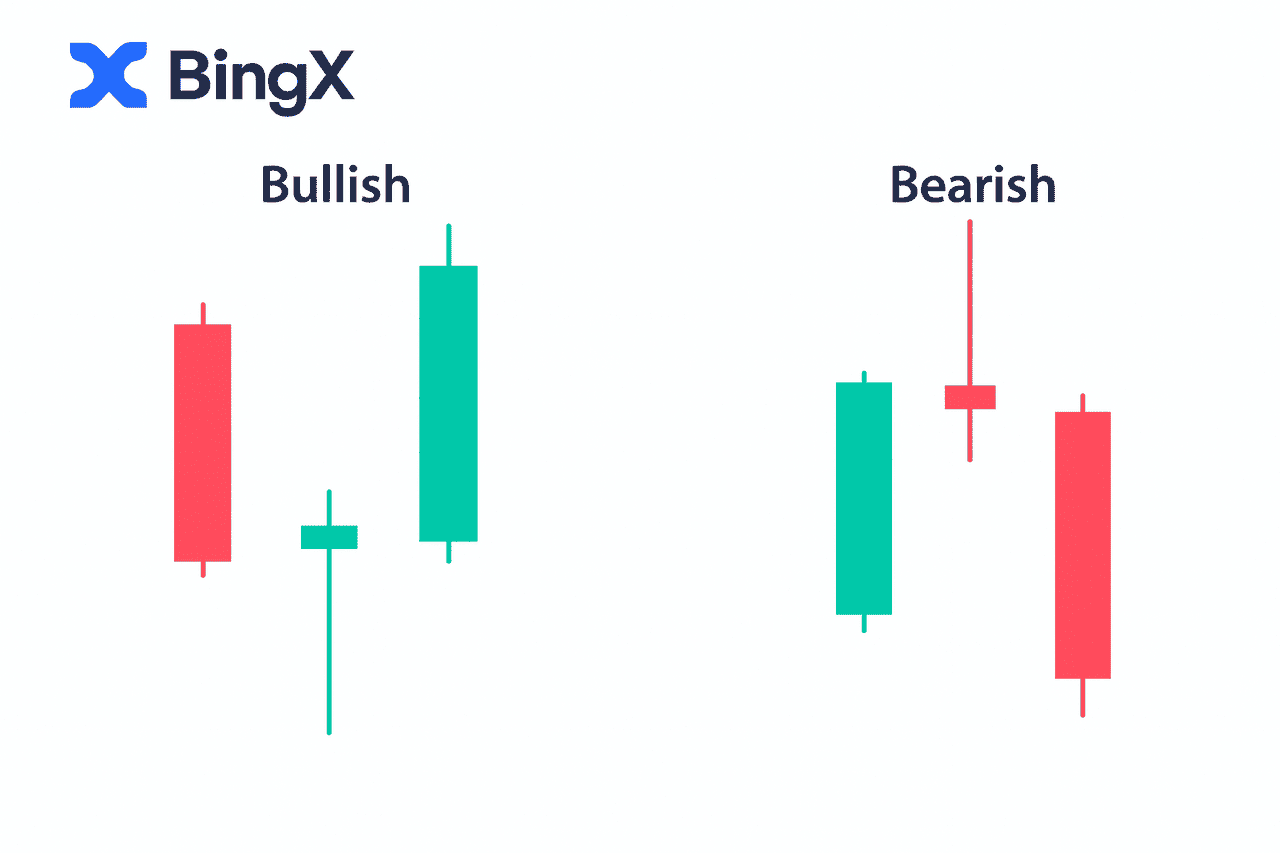
Types of Pin Bars: Bullish vs. Bearish
Pin bars are powerful because they clearly show rejection and a shift in market sentiment. However, the meaning changes depending on where the wick, body, and close form. Below are the three core types every crypto trader should understand.
Bullish Pin Bar (Reversal Setup)
A bullish pin bar forms when sellers push the price sharply lower, but buyers step in and reject the move. The candle leaves a long lower tail, showing that the market tested lower prices but failed to stay there.
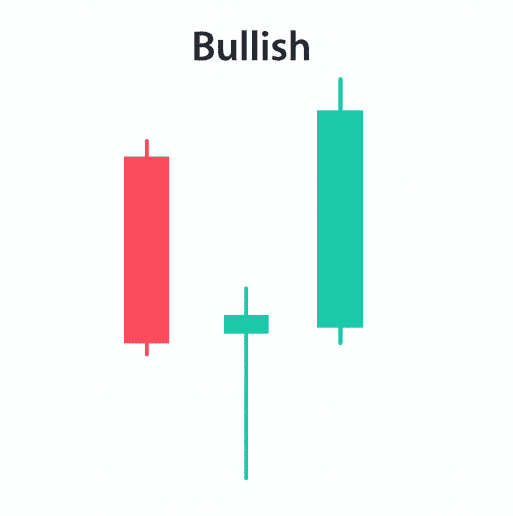
What Does a Bullish Pin Bar Indicate?
• Buyers are defending a key support level
• Selling pressure is weakening
• A potential bullish reversal
This pattern often appears on Bitcoin, Ethereum, and altcoins after panic-driven sell-offs. When the close is near the candle’s high, it signals buyers regained full control.
Read more about panic selling: Should You Sell, HODL, or Buy the Dip? A Deep Dive Into Extreme Crypto Fear
Bearish Pin Bar (Reversal Setup)
A bearish pin bar forms when buyers push price upward, but sellers reject the move aggressively. The candle leaves a long upper wick, indicating strong selling pressure near resistance.
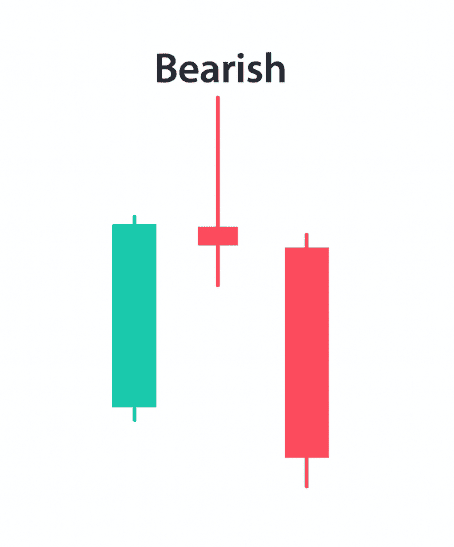
What Does a Bearish Pin Bar Indicate?
• Sellers are defending a key resistance level
• Buyers failed to push higher
• A potential bearish reversal
Bearish pin bars are especially powerful when they appear after rallies or at major resistance zones, where buying momentum is already stretched.
Pin Bar Continuation Pattern
Not all pin bars mark reversals. Some form in the direction of the dominant trend, acting as continuation signals. For example, in an uptrend, a bullish pin bar above support confirms that buyers are stepping in on every dip. In a downtrend, a bearish pin bar below resistance confirms sellers are controlling every bounce.
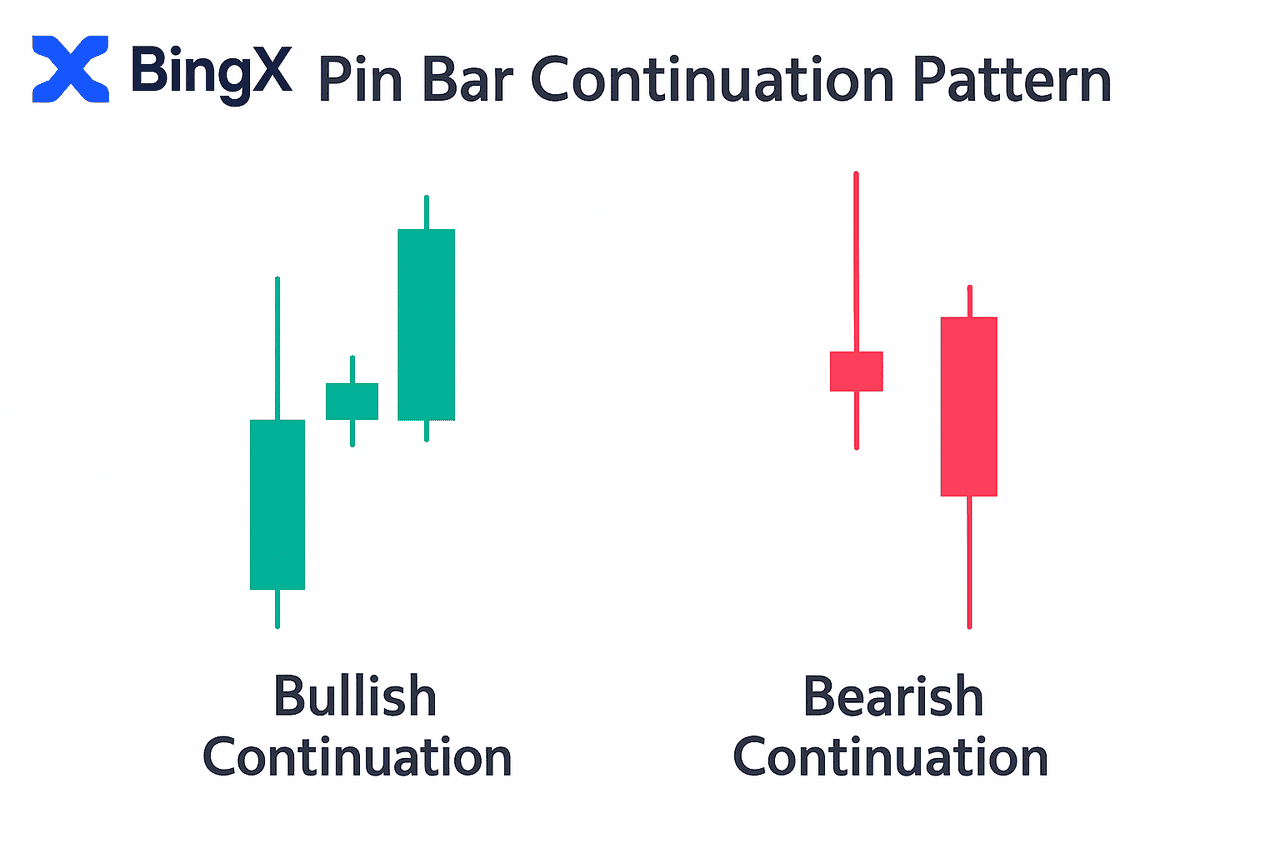
These continuation pin bars are considered high-probability setups because they follow existing market momentum rather than fight it.
How Pin Bars Form and How to Confirm Strong Signals
A pin bar forms when the market tests a level and gets rejected, leaving a long wick. Price moves strongly in one direction but snaps back, showing a failed breakout and a shift in sentiment. A bearish pin bar traps late buyers at resistance. A bullish pin bar traps late sellers at support.
This shift reveals that the dominant trend regained control, which is why pin bars often mark reversal points or trend continuation setups.
But pin bars only work when backed by structure. A strong pin bar usually appears where the market has a reason to reverse or continue, not in the middle of random noise.
A pin bar signal is strongest when:
• It forms at a major support or resistance level
• It aligns with the dominant trend
• The wick rejects a key price level (swing high/low, liquidity zone)
• Volume supports the reversal
• It appears after an extended move or overreaction
Avoid weak or failed setups when:
• The pin bar forms inside a choppy consolidation range
• The wick is too small to show real rejection
• It goes against trend with no structural support
• The “pin bar fails” quickly because no confirmation candle appears
This combination of psychology + confirmation helps traders filter real signals from market noise and improves the accuracy of trading pin bars in crypto charts.
How to Use Pin Bar in Your Trading Strategy: Step-by-Step Guide
A pin bar becomes a strong trading signal when it forms at a key level. In the ETH/USDT example, price tapped the $3,030 support zone and printed a bullish pin bar with a long lower wick, showing clear rejection and a potential reversal.
Once the next candle broke above the pin bar high (around $3,219), the long setup was confirmed. Risk was defined by placing the stop loss below the pin bar low ($3,030), and the take-profit target was set at the next resistance zone near $3,640.
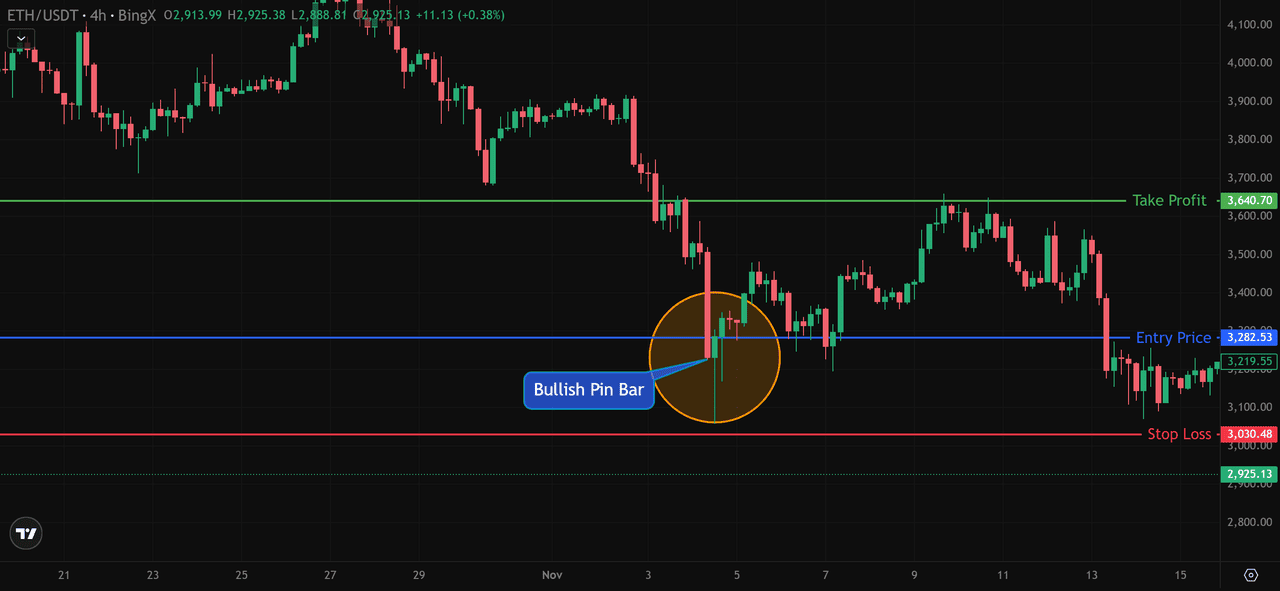
Source: ETH/USDT Trading Chart on BingX
Trade Setup:
• Entry: Break above pin bar high ($3,219)
• Stop Loss: Below pin bar low ($3,030)
• Take Profit: Next resistance ($3,640)
This simple structure shows how pin bars offer clean, controlled entries when combined with support and resistance.
How to Combine Pin Bars With Other Technical Tools
Pin bars become far stronger when they align with other technical signals. In the ETH/USDT setup above, the bullish pin bar formed exactly at the $3,030 support zone, with RSI dropping to around 25 and Stochastic dipping into the 10–15 oversold range.
This showed clear rejection, seller exhaustion, and a high-probability reversal rather than random volatility.
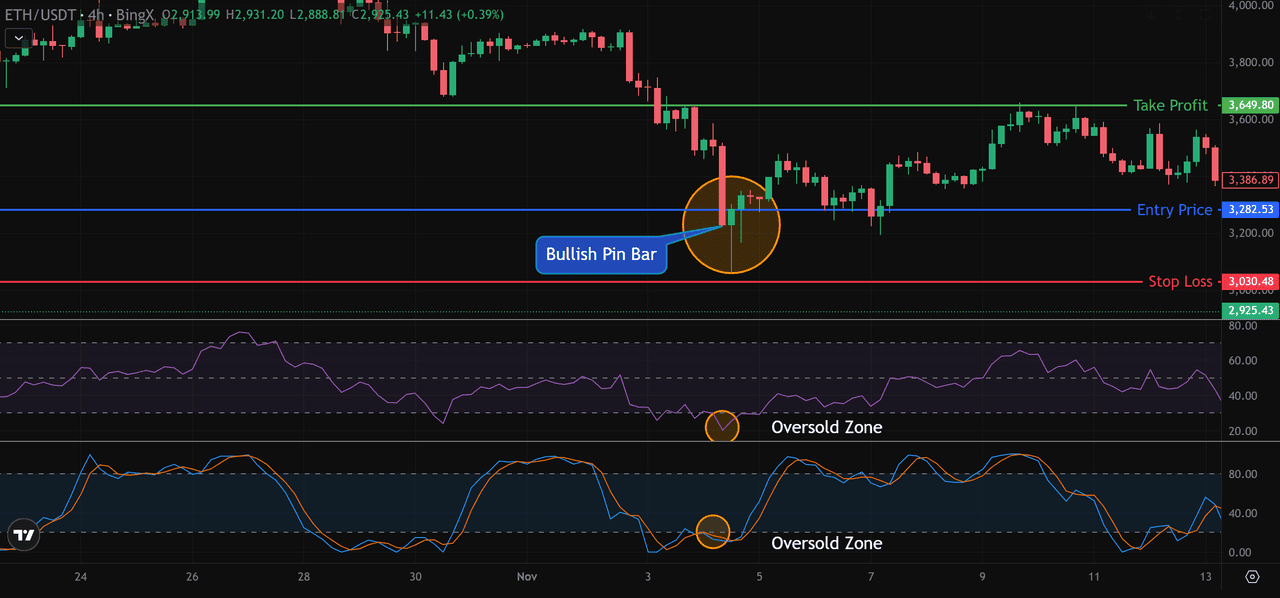
Source: ETH/USDT Trading Chart on BingX
To strengthen pin bar signals, confirm them with:
• Relative Strength Index (RSI) or Stochastic RSI at oversold/overbought readings (e.g., RSI < 30, Stoch < 20)
• Key support or resistance zones (e.g., $3,030 as shown)
When these factors align with the pin bar wick rejection, the reversal setup becomes more reliable and filters out weak signals.
Final Thoughts: Mastering the Pin Bar Strategy
A good pin bar is simply evidence of rejection, and in crypto, rejection often leads to sharp moves. The pattern works, but only when the context supports it. The best results usually come from pin bars that appear at obvious support or resistance, align with trend direction, and show clean confirmation on the next candle.
If you approach them with a structured plan and clear risk rules, pin bars can simplify your trading decisions instead of adding noise. Focus on quality setups, not quantity, and the strategy becomes far more useful.
Related Articles
3. Simple Moving Average(SMA) vs Exponential Moving Average(EMA) in Crypto Trading: Differences to Know
FAQs on Pin Bar Candlestick Patterns
1. Are pin bars reliable for crypto trading?
Yes, when used correctly. Pin bars are reliable only when they form at major support or resistance, align with trend direction, and show clear rejection. Random pin bars in the middle of noise should be ignored.
2. Which timeframe is best for trading pin bars in crypto?
Pin bars work on every timeframe, but the most consistent results usually come from the 4H, daily, and weekly charts. Lower timeframes (5m, 15m) produce more noise and more false signals.
3. Do pin bars work on Bitcoin and altcoins?
Absolutely. Pin bars work across BTC, ETH, and all major altcoins, because they are based on pure price action, not project fundamentals or token type.
4. How do I confirm a pin bar before entering a crypto trade?
Use simple confirmations such as: Break of the pin bar high/low, Support or resistance structure, RSI or Stochastic showing oversold/overbought, Trend direction from the 20 or 50 EMA. The more confluence you have, the stronger the setup.
5. Where do I place a stop loss when trading pin bars?
A stop loss should sit below the low of a bullish pin bar or above the high of a bearish pin bar. This placement gives the candle room to breathe while still protecting your trade if the rejection fails. It also keeps your risk anchored to a clear structural level, rather than placing stops too close where normal volatility can knock you out prematurely.
6. Why do pin bars fail sometimes for crypto?
Pin bars fail when they appear in the wrong context. A pin bar forming inside a choppy consolidation range or against strong momentum usually carries little meaning. Weak volume, small wicks that show no real rejection, or the absence of a confirmation candle can also cause the setup to break down quickly. In most cases, a failed pin bar simply reflects poor location or insufficient strength behind the move.