Bitcoin recently climbed to a new all-time high past $123,000, but it didn’t stay there for long. The price has since dropped to about $117,000, and the market is now in a cooling-off phase. That’s normal; after a big rally, prices often pause or pull back as traders take profits and momentum slows.
We’re also seeing signs of this in the broader crypto market. Sentiment has become a bit more cautious, with the Crypto Fear & Greed Index slipping out of “extreme greed” territory.
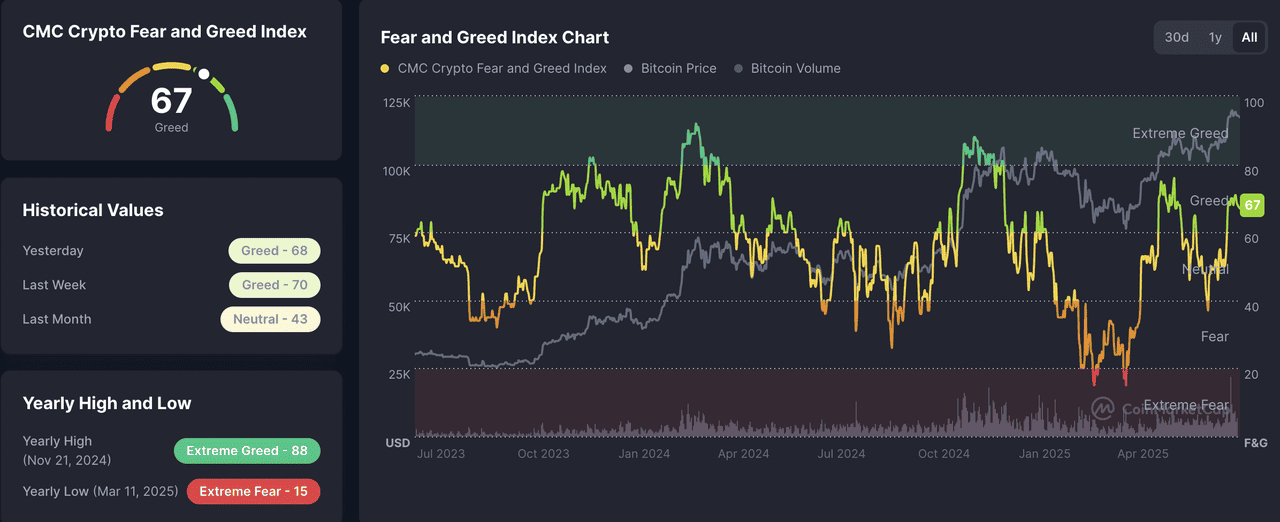
At the same time, funding rates, which indicate the cost of holding long positions, have returned to more stable levels. In simple terms, hype is starting to calm down.
But this doesn’t mean the rally is over. Many traders believe this pullback is actually a healthy correction, not a sign of weakness. And there’s one key reason for their optimism: Bitcoin's golden cross on the daily chart. Could this be just a shakeout before something much bigger? That’s what we’re about to find out.
In this article, we’ll break down what this golden cross means, why it matters, and whether it could send Bitcoin toward $150,000 in the months ahead. We’ll look at the historical context, technical targets, and the key levels to watch next.
What Is a Golden Cross and Why It Matters in Crypto?
So what’s this signal that’s got traders paying attention again?
A golden cross is a classic chart pattern that occurs when Bitcoin’s 50-day simple moving average (SMA) (which reflects short-term price action) crosses above the 200-day SMA, which represents the longer-term trend. In simple terms, it signals that momentum is shifting from bearish to bullish.
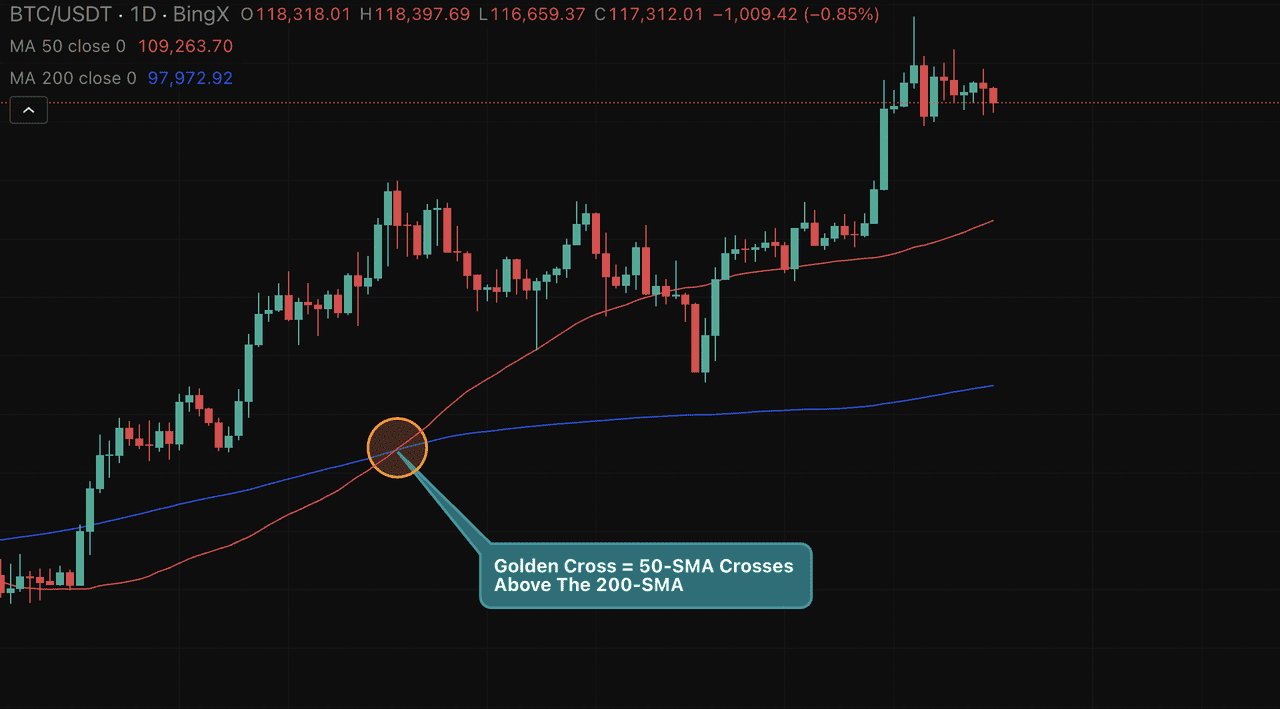
Source: BTC/USDT Trading Chart on BingX
This might sound technical, but historically, this crossover has led to massive price gains.
Take a look at the chart below:
Every time Bitcoin has printed a golden cross on its longer timeframes, a major rally followed. In 2015, it triggered a 139% rally. In 2016, the golden cross marked the beginning of a 2,200% bull run, and again in 2020, it preceded a rally of 1,190% as BTC climbed from around $10,000 to nearly $70,000.
Now, we’ve seen the same signal flash again in May 2025, with the crossover happening around the $65,000 mark. So far, BTC has already climbed more than 12%, but history suggests the real move could still be ahead.
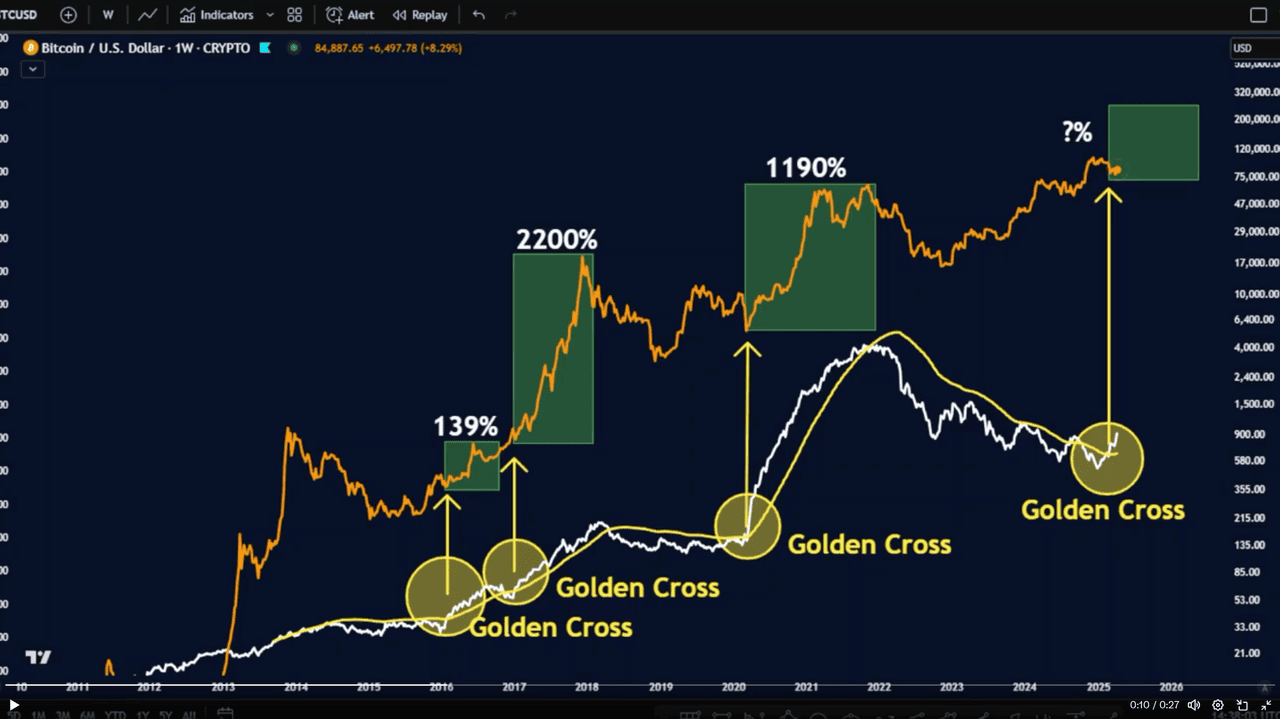
BTC/USD Chart Highlighting Previous Golden Crosses and Historical Rallies. Source: Merlijn The Trader via X
It’s worth noting: the golden cross is a lagging indicator, meaning it doesn’t predict a rally before it starts, it confirms that the trend is already gaining strength. But when combined with rising trading volume, healthy pullbacks, and strong macro support, it becomes a powerful tool for traders.
On the flip side, if the 50-day SMA crosses below the 200-day, we get what’s called a death cross, a warning sign of potential downtrend ahead.
But for now, the bulls are in control. And if history repeats—or even rhymes—the golden cross may be setting the stage for Bitcoin’s next major leg up.
Bitcoin Chart Breakdown: Golden Cross and the Road to $150K
Despite the recent dip from $123K to around $117K, Bitcoin’s overall structure still favors the bulls, and the chart tells us why.
The key technical signal is the golden cross, which appeared on May 23, 2025, when the 50-day simple moving average (SMA) crossed above the 200-day SMA. This bullish crossover occurred around the $93,000 level, confirming a shift in market momentum just before BTC broke out of a long-term consolidation triangle.
Following the golden cross, Bitcoin surged nearly 48%, hitting an all-time high of $123,315 in late June. That move wasn’t just technical, it was supported by clean breakout structure, rising volume, and a bounce off the triangle’s upper trendline.
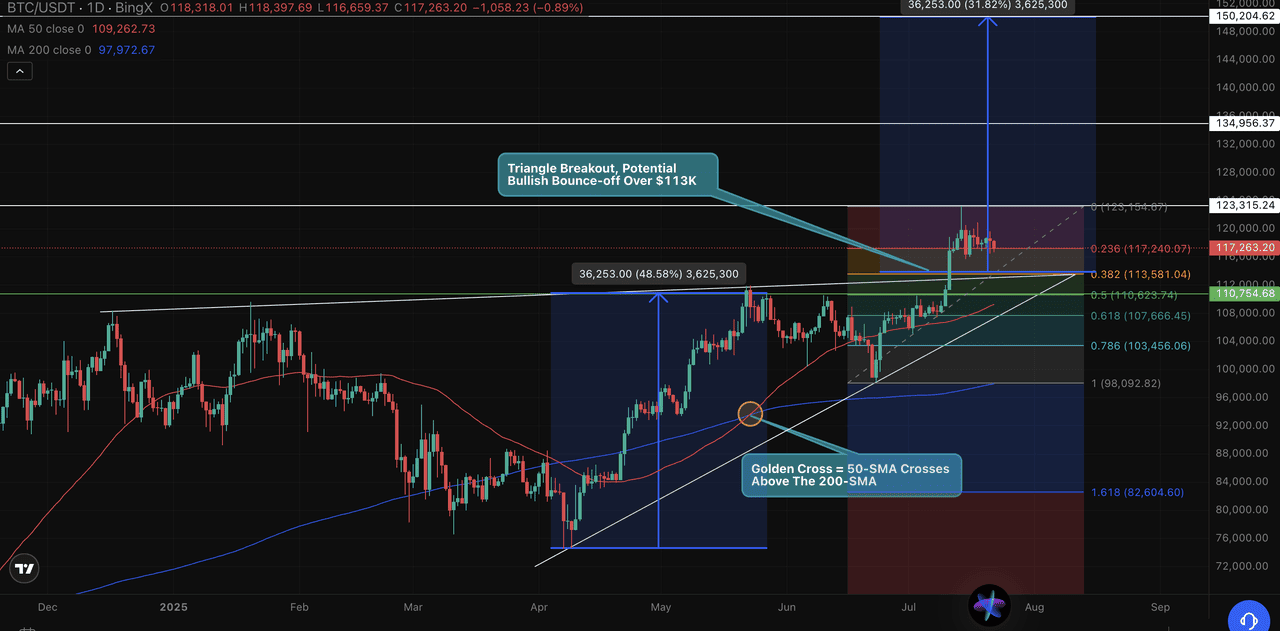
Source: BTC/USDT Trading Chart on BingX
While BTC has pulled back since then, the technical landscape remains constructive.
Here's how it breaks down:
• Golden cross confirmation: $93K on May 23
• Immediate support zone: $113K–$115K (Fib 0.382)
• Stronger support: $110,754 (Fib 0.5), and $107,666 (Fib 0.618)
• Major technical floor: $105K–$108K, near rising trendline and 50-day SMA
• Key resistance: $123K–$125K; BTC needs a daily close above to confirm a fresh breakout
• Fibonacci extension targets:
- First target: $134,956
- Second target: $150,204
This consolidation, coming right after a breakout, is not uncommon. Pullbacks after golden crosses often create new accumulation zones before the next leg up. The key now is whether BTC can hold above the $110K–$113K zone and reclaim $123K with conviction.
Potential Trade Setup
• Entry Option 1: Bounce confirmation from $113K–$114K zone
• Entry Option 2: Break and retest above $125K
• Targets:
- First: $134K
- Second: $150K
• Stop-loss idea: Below $105K (under Fib 0.618 and 50-SMA support)
In short, the golden cross has already delivered its first move. But if BTC can defend key supports and reclaim resistance, we may just be in the early innings of a much larger rally, potentially toward $150,000.
The Bigger Picture: Macro Trends Fueling the Bull Case
Beyond technical signals, Bitcoin’s rally is being reinforced by powerful macro trends that continue to tilt the odds in favor of the bulls.
• The Federal Reserve has held rates steady at 4.25–4.5%, but recent comments from Fed Governor Christopher Waller suggest a shift is coming. Markets are now pricing in a likely rate cut by Q4 2025, with the first move possible as early as September. Historically, lower rates weaken the dollar and drive capital into risk assets like Bitcoin.
• Meanwhile, institutional demand is surging. Spot Bitcoin ETFs, led by BlackRock’s IBIT and Fidelity’s FBTC, recorded $2.39 billion in net inflows in just one week this July, pushing total assets past $152 billion. That kind of inflow is hard to ignore.
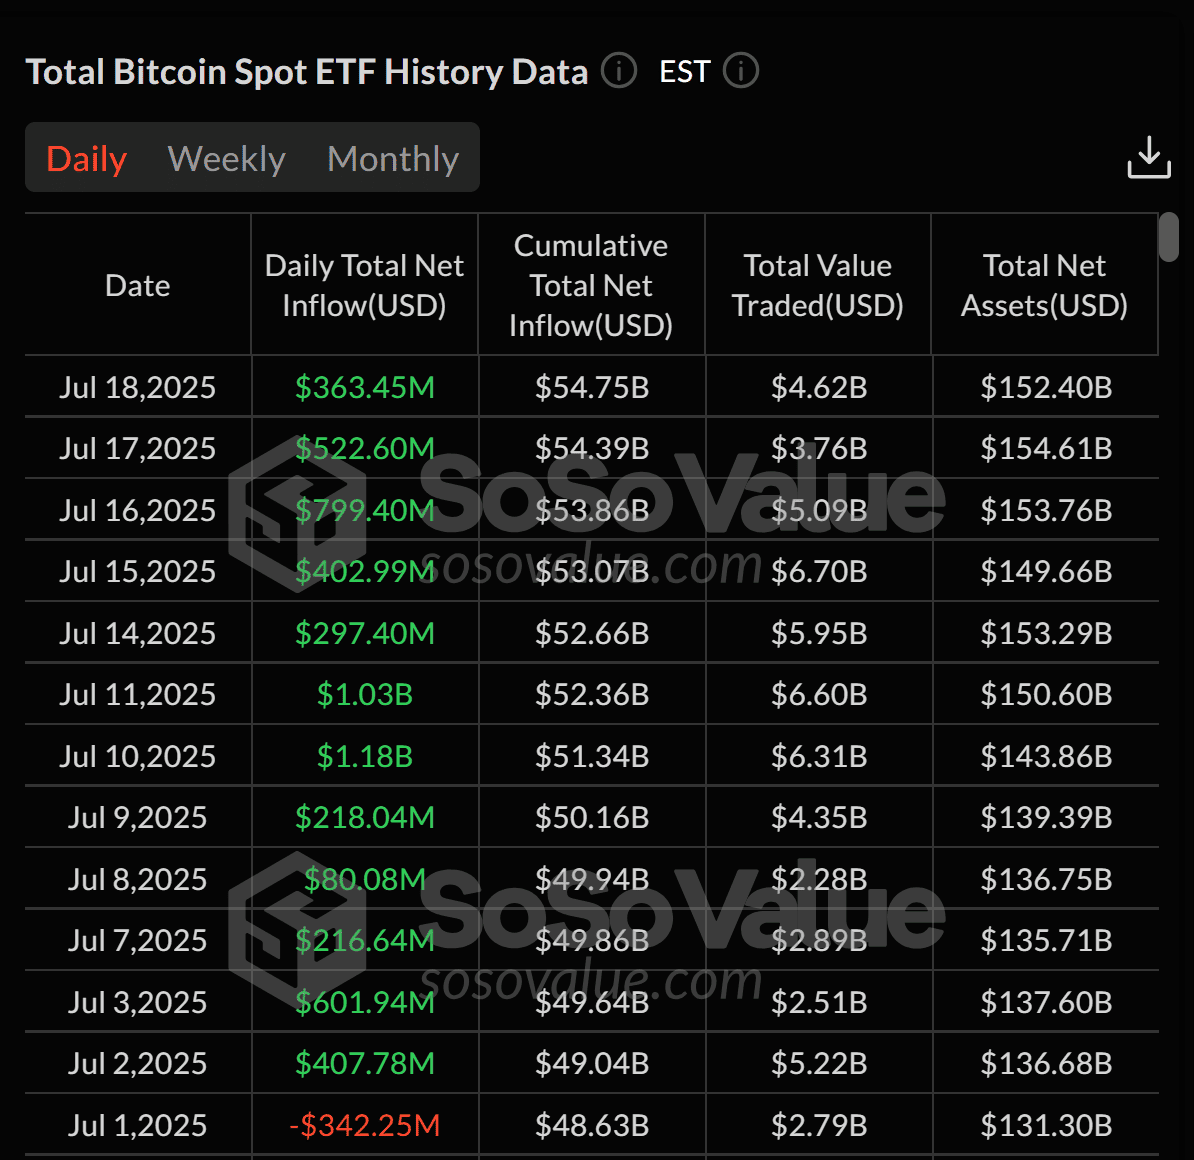
Spot Bitcoin ETFs See 12-day inflow streak. Source: SoSoValue
• On the global front, persistent weakness in the yen and euro is driving investors toward BTC as a hedge against fiat instability. At the same time, corporate and sovereign accumulation continues. Japan’s Metaplanet now holds over 7,800 BTC, surpassing El Salvador’s 5,750 BTC.
With Bitcoin dominance rising again across the crypto market, confidence is clearly flowing back into large-cap assets. Combined with the technical setup, the macro backdrop supports the view that $150,000 BTC is not just possible, it’s increasingly likely.
Key Considerations When Using Golden Cross in Bitcoin Price Prediction
The golden cross is a popular bullish signal, but it has limitations when predicting Bitcoin’s price moves. As a lagging indicator, it often reflects momentum that has already played out, making it prone to false signals in volatile markets. To improve accuracy, traders often combine it with other technical tools like the Relative Strength Index (RSI) to gauge overbought conditions, the moving average convergence divergence (MACD) for momentum confirmation, or Bollinger Bands to identify volatility and potential breakout zones. Using these indicators together can provide a more balanced view before making trading decisions.
Conclusion: Is the Bitcoin Golden Cross a Dip or Opportunity?
The recent golden cross on Bitcoin’s daily chart reinforces the long-term bullish trend, even as BTC pulls back from its all-time high near $123,000. Historically, this pattern has marked the beginning of major rallies, not the end of them.
This dip could simply be a healthy reset, allowing momentum and sentiment to cool before the next leg up. But for the rally to continue, Bitcoin must reclaim and close above the $123K–$125K resistance zone with strong volume.
If that breakout holds, the technical and macro backdrop both point toward a potential move to $150,000 in the coming months.
Still, this remains a market driven by confirmation and momentum. Waiting for key levels to validate, and managing risk accordingly, will be crucial for navigating what could be one of Bitcoin’s most explosive phases yet.
Disclaimer: This article is for informational purposes only and does not constitute financial advice. Cryptocurrency markets are highly volatile and involve significant risk. Always do your own research and consult a financial advisor before making investment decisions.
Related Articles
FAQs: Golden Cross & Bitcoin Price Outlook
1. What is the golden cross in Bitcoin?
A golden cross is a bullish chart pattern that forms when the 50-day simple moving average (SMA) crosses above the 200-day SMA. It signals that momentum is shifting in favor of buyers and is often viewed as a confirmation of a long-term uptrend.
2. When did Bitcoin last form a golden cross?
The most recent golden cross appeared on May 23, 2025, with Bitcoin trading around $93,000. It followed a breakout from a long-term consolidation pattern and preceded a move to a new all-time high.
3. Does a golden cross guarantee price increases?
No, it doesn't guarantee gains, but historically it has preceded major rallies. It's considered a lagging indicator, meaning it confirms existing momentum rather than predicting it in advance.
4. What are the key resistance and support levels for BTC now?
• Resistance: $123K–$125K (all-time high zone)
• Support: $113K–$115K (Fib 0.382), $105K–$108K (50-SMA and major trendline)
5. How high can Bitcoin go in this cycle?
If historical golden cross patterns repeat and macro trends stay supportive, many analysts see $150,000 as a realistic upside target in this cycle. You can also use BingX AI to analyze market trends and get insights on Bitcoin price movements. However, remember this is not financial advice. Always DYOR (Do Your Own Research) before making any trading decisions.