Join the Trading Community: Learn & Earn with BingX.
Source: TradingView & BingX
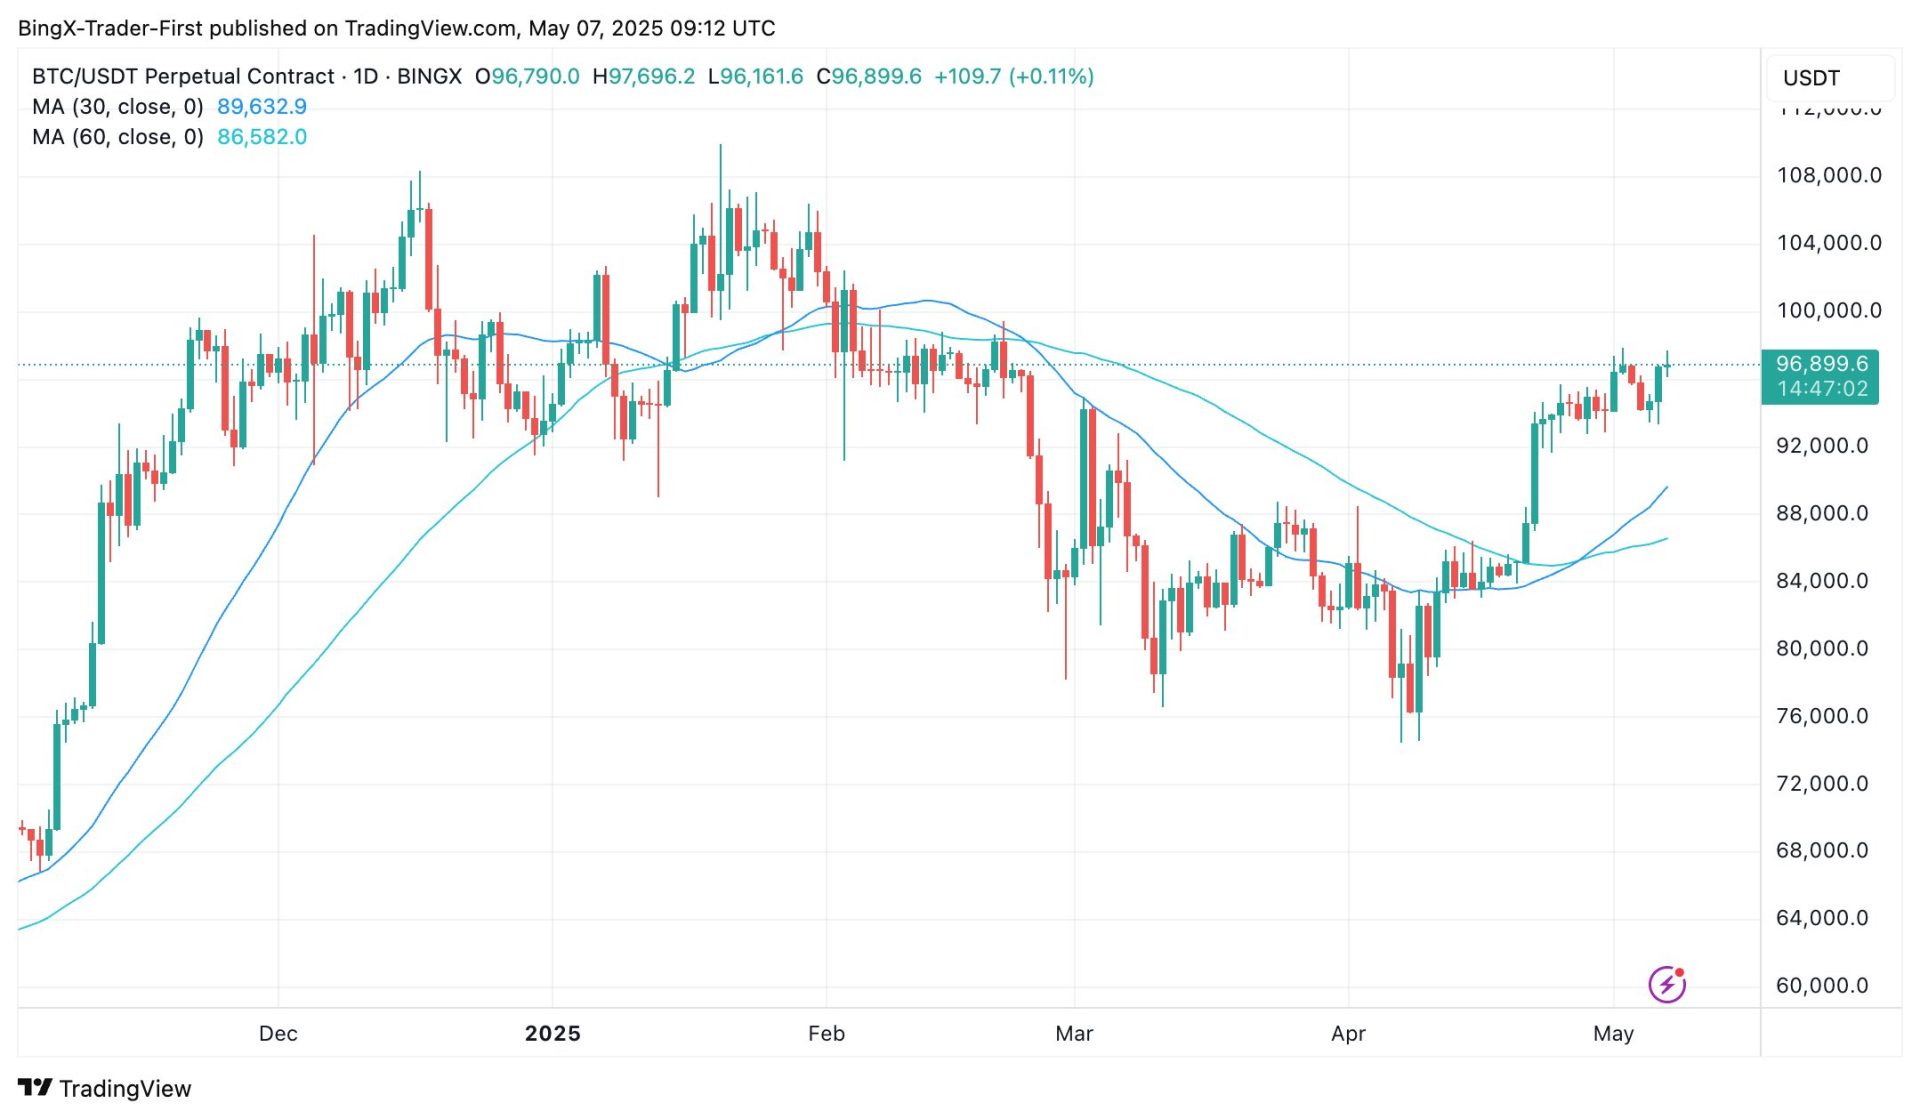
The 4-hour chart for BTC/USD shows Bitcoin trading at $96,899 as of May 7, 2025, marking an increase of 0.11% from recent levels. The price has surged from a low of $93,770 earlier in the period, breaking above the resistance near $95,000 and approaching the previous high of $97,956. The 30-period moving average at $89,632.9 and the 60-period moving average at $86,582.0 are well below the current price, supporting the short-term bullish momentum. The candlestick patterns indicate strong buying pressure, with a large bullish candle driving the recent breakout, though volume has slightly decreased, suggesting a potential slowdown in momentum. The RSI on the 4-hour chart is at 60.80, indicating a slightly overbought condition, while the MACD shows a bullish crossover, supporting the upward move.
On the 1-day chart, Bitcoin’s broader trend remains bullish, with the price climbing from $58,846 in late 2024 to the current level of $96,899. The daily chart shows the price retesting the upper boundary of a long-term ascending channel, which has acted as resistance around $97,956 previously. The 200-period moving average at $90,986.22 continues to slope upward, reinforcing the overall bullish structure, and the recent price action has been accompanied by a spike in volume, indicating strong buyer interest. However, the RSI at 71.46 on the daily chart suggests the asset is in overbought territory, which could lead to a pullback, while the MACD remains bullish but shows signs of divergence, hinting at potential weakening momentum.
From a technical perspective, Bitcoin’s current levels on both timeframes suggest a strong but potentially overstretched rally. On the 4-hour chart, the bullish MACD and breakout above $95,000 are positive, but the RSI nearing overbought levels and declining volume indicate caution, with resistance at $97,956 likely to be tested again. On the 1-day chart, the overbought RSI and channel resistance suggest a risk of correction if the price fails to break $97,956, with support near $93,770 or the 200-period moving average at $90,986. A sustained move above $97,956 could open the door for further gains toward $100,000, while a drop below $93,770 might signal a deeper pullback.
Disclaimer: BingX does not endorse and is not responsible for or liable for any content, accuracy, quality, advertising, products, or other materials on this page. Readers should do their own research before taking any actions related to the company. BingX is not responsible, directly or indirectly, for any damage or loss caused or alleged to be caused by or in connection with the use of or reliance on any content, goods, or services mentioned in the article.