
Sometimes the earliest hint of a trend reversal isn’t a complex indicator or a multi-candle structure, it’s a single candle that completely shifts the mood of the chart. Crypto traders often see it just before momentum fades, yet many overlook it because it forms quickly and blends into fast price action. But when it appears at the top of a strong move, it can reveal more about buyer exhaustion and hidden selling pressure than most indicators do.
This is what the shooting star candlestick trading pattern is used for.
What Is the Shooting Star Candlestick Pattern?
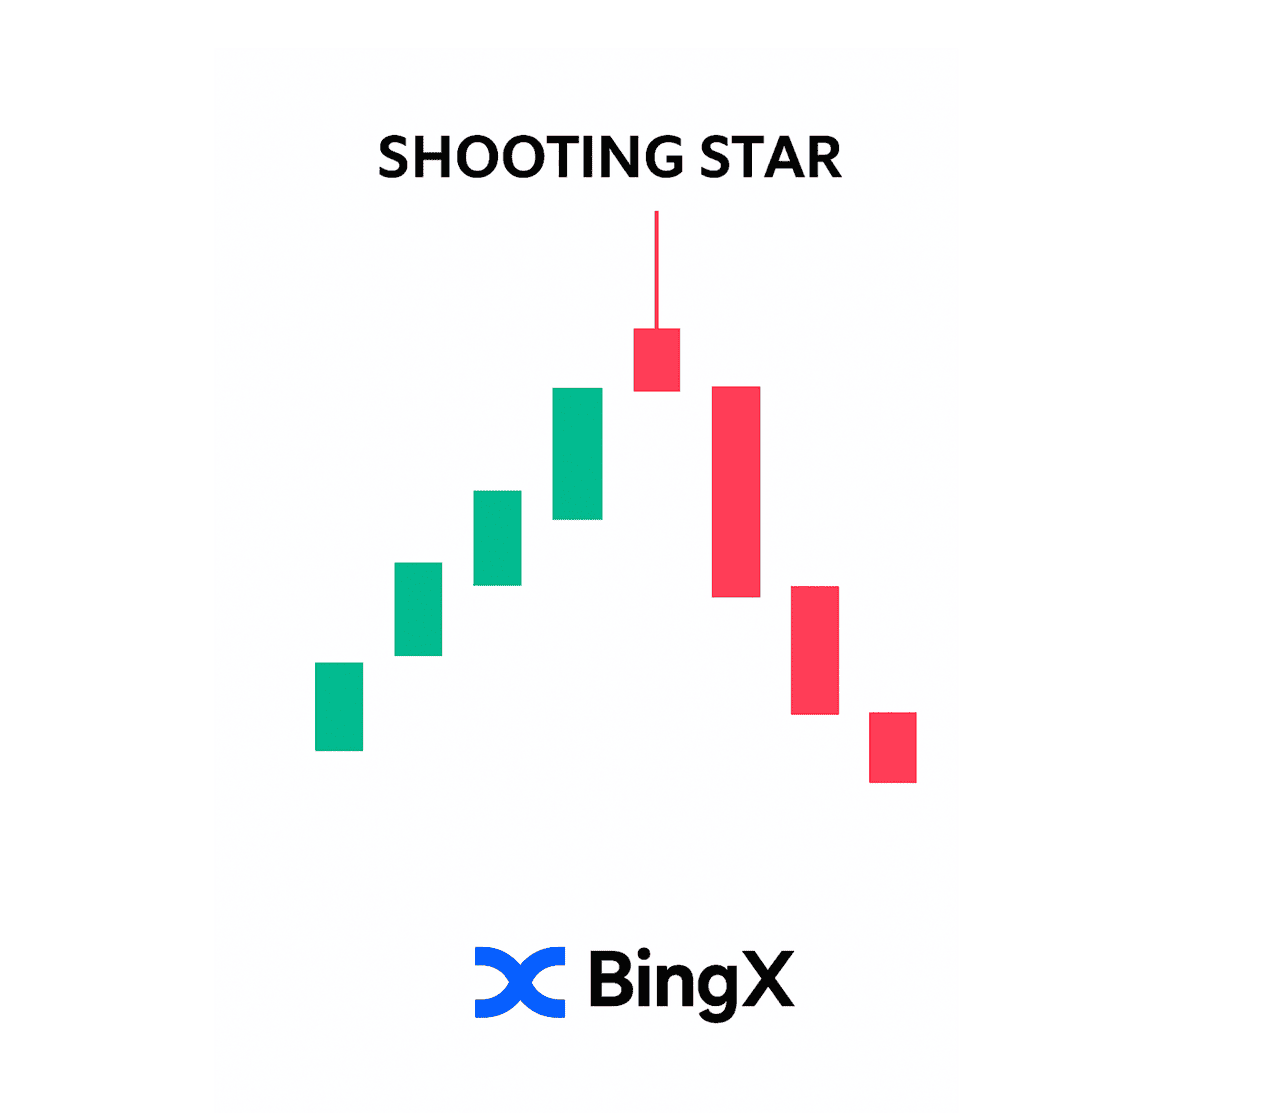
A Shooting Star is a single-candle bearish reversal pattern that appears after an uptrend. It forms when price pushes sharply higher during the session but fails to hold those gains, closing near its low.
The result is a candle with a small real body near the bottom and a long upper wick that shows strong rejection from higher levels.
This structure tells a simple story: buyers attempted to extend the rally, but sellers stepped in aggressively and erased most of the upside. That shift from bullish enthusiasm to sudden selling pressure is what gives the Shooting Star its value as an early warning of potential trend exhaustion.
How to Identify a Shooting Star on a Crypto Chart
Spotting a Shooting Star is straightforward once you know what to look for. The pattern has a very specific shape and must appear in the right context to carry any reversal meaning.
A valid Shooting Star forms when:
1. It appears after a clear uptrend: The pattern has no value sideways or declining markets. It must come after a sustained move higher.
2. The upper wick is at least two to three times the size of the body: This long wick shows that price attempted to break higher but was firmly rejected.
3. The real body is small and positioned near the candle’s low: This means sellers pushed the price back down, erasing most of the bullish attempt.
4. There is little to no lower wick: A clean rejection is more reliable when the candle closes near its lowest point.
5. The closing price is near the bottom of the candle: This confirms that selling pressure dominated the session.
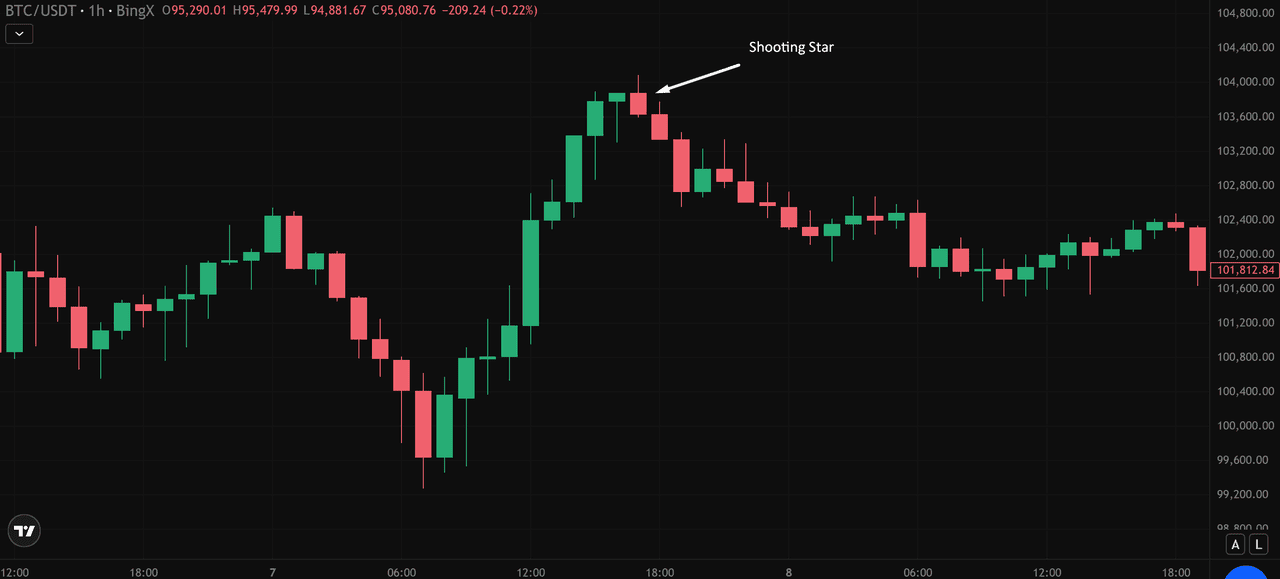
Source: BTC/USDT Trading Chart on BingX
Shooting Star vs. Inverted Hammer: What’s the Difference?
Although the Shooting Star and Inverted Hammer share the same shape, a small real body with a long upper wick, they convey opposite signals because they occur at different points in the trend. The Shooting Star is a bearish reversal signal at the end of an uptrend, while the Inverted Hammer is a bullish reversal signal appearing after a downtrend.
• Shooting Star: Forms at the top of an uptrend and signals a potential bearish reversal.
• Inverted Hammer: Forms at the bottom of a downtrend and suggests a potential bullish reversal.

Same shape, opposite context. That context is what determines whether the candle warns of sellers taking control or buyers attempting a recovery.
How to Use the Shooting Star Pattern in Your Crypto Trading Strategy
A Shooting Star becomes actionable only when the next candle confirms the rejection. The BTC/USDT setup below shows how to turn the pattern into a structured trade.
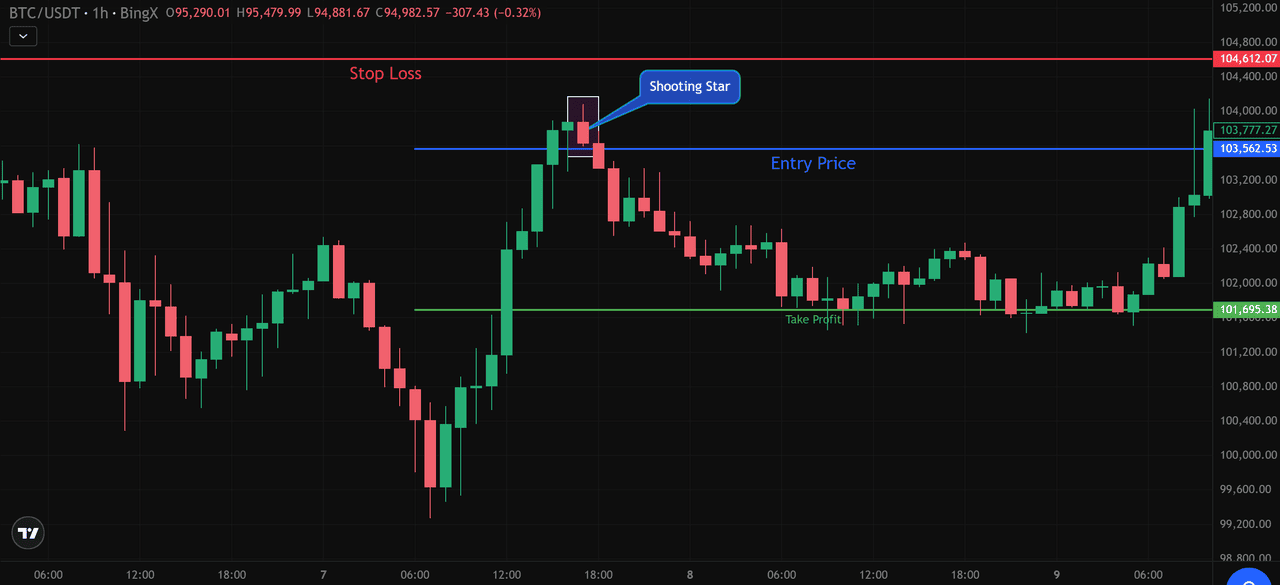
Source: BTC/USDT Trading Chart on BingX
1. Entry Trigger: After the Shooting Star forms near $103,700, the following candle closes below its low, confirming seller control. This gives a clean entry just under the breakdown at $103,560.
2. Stop-Loss Placement: The stop-loss is placed above the wick high, where the pattern is invalidated if price breaks through. In this setup, that level sits around $104,612.
3. Take-Profit Target: The first target is the nearest support zone, located near $101,695. Price moves directly into this area, completing the setup with a straightforward risk management (risk-to-reward structure).
4. Why This Setup Works: The pattern forms after a strong rally, shows clear rejection at the highs, and receives immediate confirmation from the next candle. With defined entry, stop-loss, and support-based take profit, this makes the Shooting Star an efficient and beginner-friendly reversal setup.
Best Indicators to Confirm a Shooting Star Pattern
A Shooting Star becomes more reliable when it aligns with momentum and market-structure signals. On the BTC/USDT chart, multiple indicators supported the reversal, making the pattern stronger and the short setup more convincing.
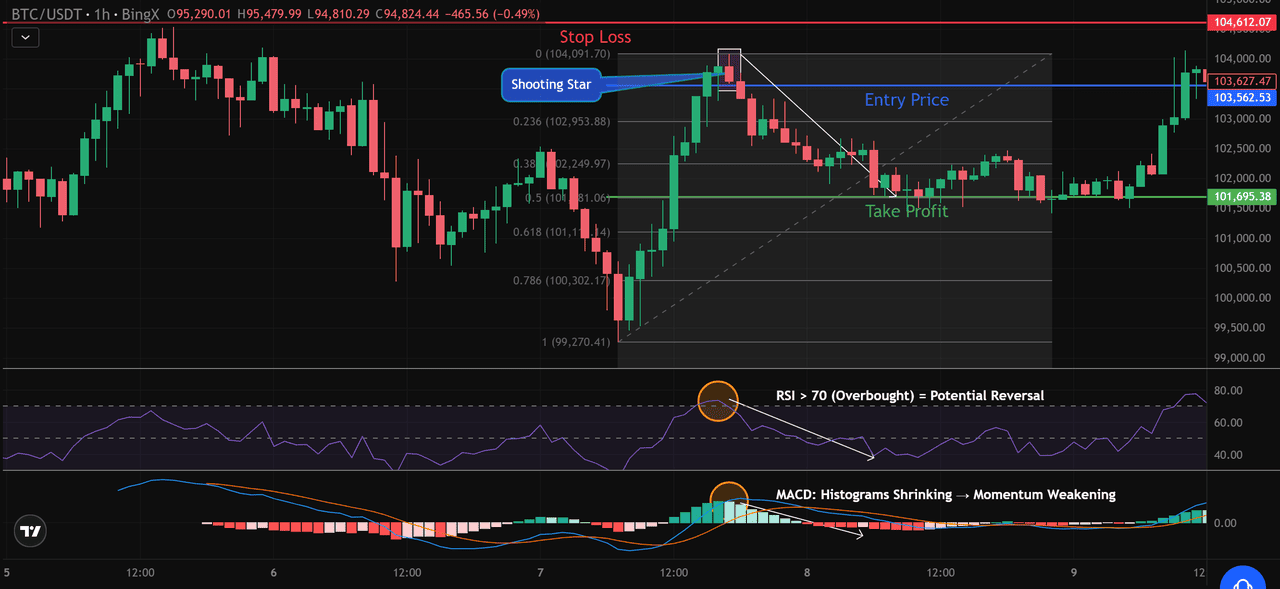
Source: BTC/USDT Trading Chart on BingX
1. Relative Strength Index (RSI)
On the chart, the RSI pushed above 70 at the same time the Shooting Star formed near $103,700. This placed BTC in overbought territory, hinting that the rally was stretched. The wick rejection at the highs matched the RSI reading, signaling a potential shift from buyer strength to seller pressure.
2. Moving Average Convergence Divergence (MACD)
The MACD histogram began shrinking just before the pattern completed. Earlier bars were tall and bright, but by the time BTC reached $103,700, the bars were getting smaller, showing momentum weakening. This loss of bullish strength aligned perfectly with the rejection seen in the Shooting Star.
3. Fibonacci Levels for Reversal Confirmation and Target Setting
The Shooting Star formed close to the 23.6% Fibonacci retracement level ($102,953) from the prior swing. Price touched this area, struggled to break through, and produced a long upper wick, a typical reaction when buyers hit Fibonacci resistance.
Beyond confirming resistance, Fibonacci levels also help define realistic downside targets. In this setup, the 50% retracement level around $101,811 acted as a natural take-profit zone. After breaking below the entry level, BTC moved directly toward this 50% mark, making it a logical and structured target for traders using the Shooting Star setup.
4. Structural Resistance Zone
BTC also rejected a short-term resistance area, around $103,700–$104,000, reinforcing that sellers were active at this price range. The immediate breakdown below $103,560 confirmed that buyers could no longer defend the level.
Why This Confluence Strengthens the Signal
When the Shooting Star forms at resistance, while the RSI is overbought, the MACD shows weakening momentum, and price stalls at a Fibonacci barrier, it creates a high-confidence reversal setup.
Each indicator independently suggests fading strength, together, they significantly increase the probability of a pullback.
Common Mistakes Traders Make With Trading the Shooting Star Pattern
• Trading it without an uptrend: The pattern only signals a reversal when it appears after a clear move higher.
• Entering before confirmation: A bearish candle closing below the Shooting Star’s low is needed to validate the rejection.
• Ignoring market conditions: News-driven pumps or volatile sessions can create wick spikes that don’t reflect real selling pressure.
• Using very small timeframes: Lower timeframes often produce fake wicks; the pattern is more reliable on the 1-hour and above.
• Misidentifying the pattern: An Inverted Hammer looks similar but forms at the bottom of a trend and signals the opposite outcome.
Final Thoughts
The Shooting Star is a straightforward way to spot fading momentum at the top of an uptrend. It becomes most reliable when paired with confirmation, key resistance levels, and supporting indicators like RSI, MACD, or Fibonacci retracements. With a clear entry below the pattern, a stop above the wick, and targets based on nearby support, it provides a simple and disciplined approach to reversal trading.
Ready to practice this pattern?
Open your chart, mark recent uptrends, and start identifying Shooting Stars to see how price reacts. The more you study real setups, the easier it becomes to spot high-quality reversal opportunities in crypto markets.
Related Reading
FAQs on Shooting Star Candlestick Pattern
1. Is the Shooting Star always bearish?
Yes. The Shooting Star is strictly a bearish reversal pattern that signals potential weakness after an uptrend.
2. What timeframes are best for identifying the pattern?
It’s most reliable on the 1-hour, 4-hour, 12-hour, and daily charts. Lower timeframes often produce false wicks.
3. How is shooting star candlestic pattern different from the Inverted Hammer?
Both have similar shapes, but the Shooting Star forms at the top of an uptrend and signals bearish reversal. The Inverted Hammer forms at the bottom of a downtrend and suggests bullish reversal.
4. Can the shooting star pattern be used for scalping or intraday trading?
Yes, but with caution. Intraday setups require confirmation and supporting indicators, as volatility can easily produce fake signals.
5. Does the candle color matter for shooting star patterns?
Not much. What matters is the long upper wick, small body near the low, and rejection from higher prices. The structure is more important than whether the candle is green or red.