Bitcoin is trading near $110,690, slipping almost 2% in the last 24 hours as traders weigh U.S. inflation data against the cryptocurrency’s fragile technical setup. With July’s core Personal Consumption Expenditures (PCE) index rising to 2.9%, the highest since February according to the Bureau of Economic Analysis, the macro backdrop has become the decisive driver of BTC’s next move.
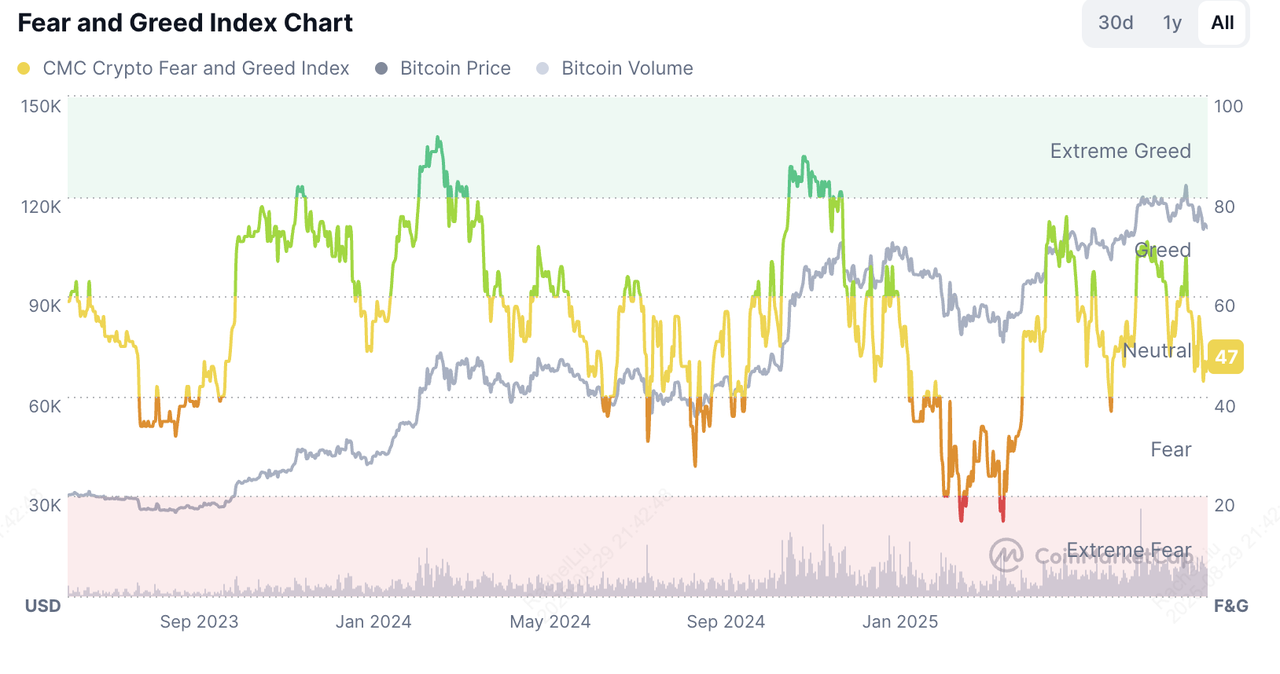
Crypto Market Sentiment Stays Neutral as U.S. Core PCE Rises to 2.9%
Fear and Greed Index: CoinMarketCap
The Federal Reserve’s preferred inflation gauge revealed that core inflation rose 2.9% year-over-year in July, up from June’s 2.8% and in line with forecasts. Consumer spending grew 0.5%, while personal income increased 0.4%, showing households remain resilient despite higher prices.
Inflation pressures were uneven. Energy costs fell 2.7% annually, while services rose 3.6%, reinforcing the view that inflation may stay sticky. This divergence leaves the Fed in a policy dilemma: cut rates to support a softening labor market, or keep rates steady to contain inflation.
Bitcoin hovered near $110,000 into the PCE release as traders trimmed risk. The report showed headline PCE at 2.6 percent year on year and core at 2.9 percent, up 0.3 percent month on month. Because the figures largely matched forecasts, odds of a September rate cut barely moved and price action stayed choppy, with BTC fading toward session lows while ETH and other large caps softened. Inflation is easing but not quickly enough to loosen financial conditions, leaving crypto sensitive to next week’s jobs data and the September Fed meeting.
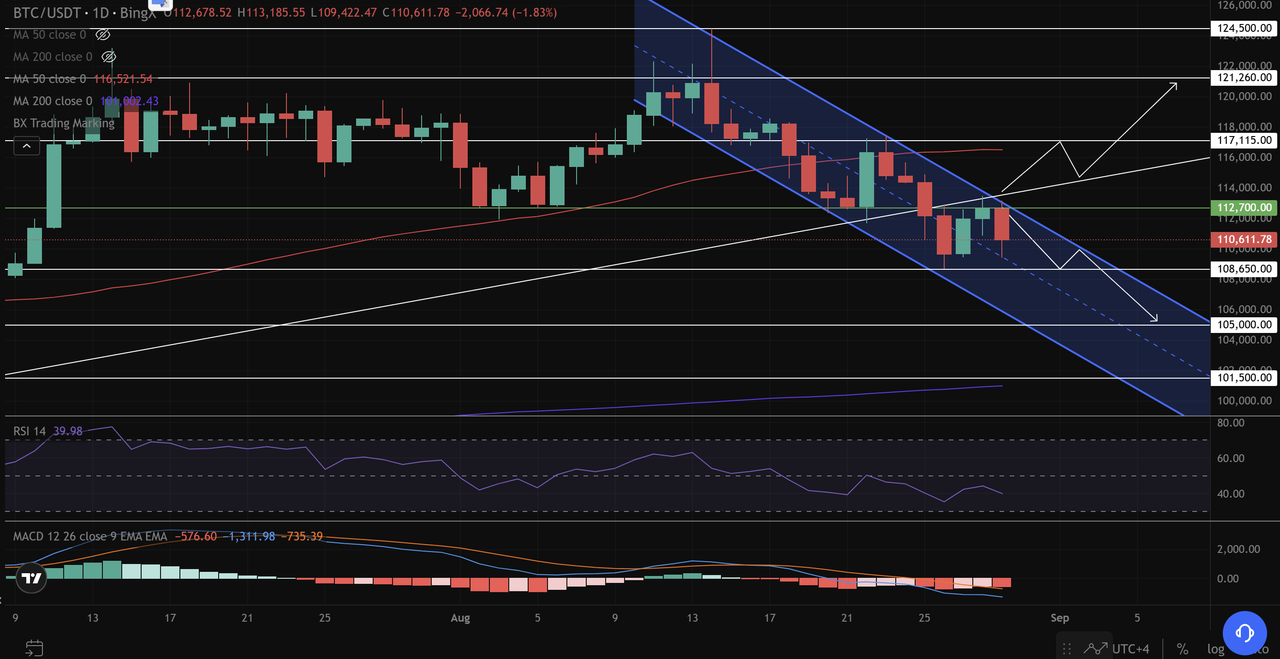
Bitcoin (BTC/USD) Caught in Descending Channel
On the technical front,
Bitcoin has been consolidating inside a
descending channel since mid-August. The pattern is marked by a string of lower highs and lower lows, reflecting persistent selling pressure. The 50-day
moving average at $112,700 remains a key hurdle, with repeated long upper wicks on daily candles confirming strong resistance.
Momentum indicators are mixed. The
RSI sits at 39, brushing against oversold territory, while the
MACD histogram remains negative, signaling sellers still dominate.
A decisive close above $112,700 could pave the way toward $117,115, with further upside toward the $121,260–$124,500 zone. A bullish breakout could take shape if the chart prints a
bullish engulfing candle or a “three white soldiers” formation.
On the downside, failure to hold $108,650 risks accelerating losses toward $105,000, with the channel floor near $101,500 acting as the last line of defense. A “three black crows” sequence here would confirm bearish capitulation.
How to Trade BTC Perpetual Futures Amid Market Volatility
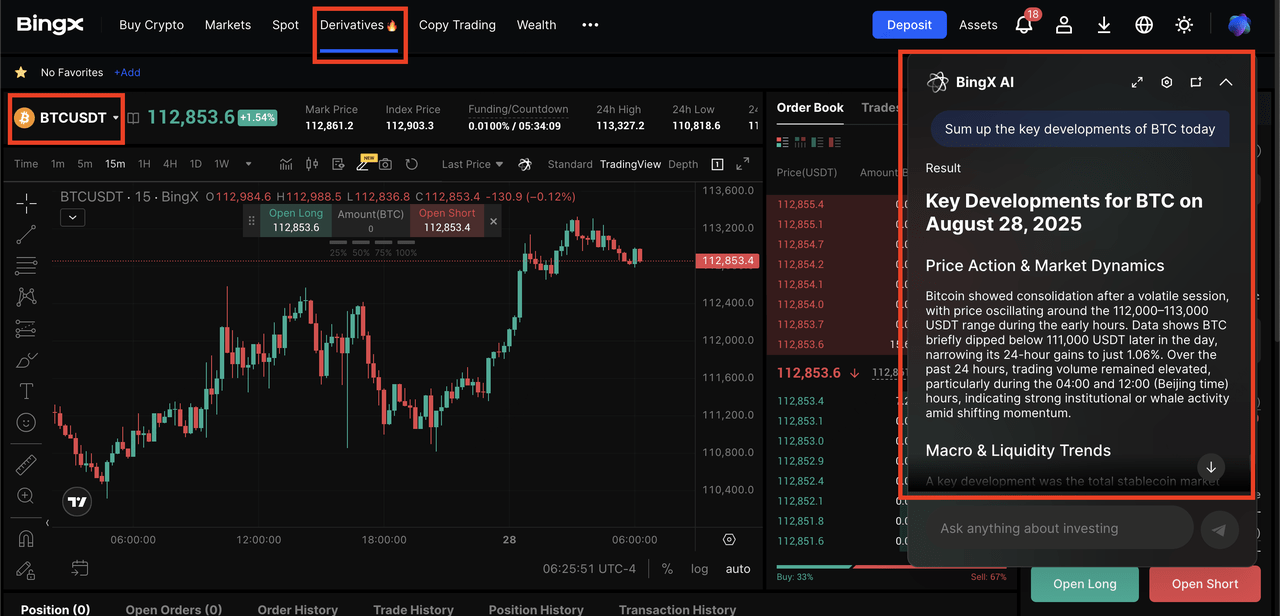
Macro releases such as the U.S. PCE often trigger sharp, short-lived swings in BTC, which can create opportunities to trade bitcoin’s volatility. If you plan to trade BTC perpetuals on BingX around the print, decide your maximum loss in advance and place orders deliberately rather than reacting to the first spike. Here's how you get started step by step
1. Create an account: Complete KYC, add USDT, and transfer funds to your Futures wallet.
2. Choose contract and leverage: Open BTCUSDT Perpetual, select Isolated margin (or Cross if you prefer), set conservative leverage (about 2–5×), and size the position modestly.
3. Place the long/short order: If you expect price to fall, place a Short (Sell) order; if you expect it to rise, place a Long (Buy) order. Enter your order size in USDT or contracts. To control slippage, especially around data release, you may need to set limit or stop-limit orders rather than market orders.
4. Manage risk and exits: Set stop loss and take profit at entry, use reduce-only on exits, and monitor margin ratio, liquidation price, and funding. If spreads widen or order-book depth thins, tighten stops, take partial profits, or stand aside.
Beyond that, you can use
BingX AI Chat to surface dynamic market insights, analyze your positions, and make more informed decisions in real time.
Bitcoin Trade Outlook and Long-Term View
For traders, the setup is straightforward. A breakout above $112,700 offers a buying opportunity targeting $117,115–$121,260, with stops below $108,500. Conversely, a drop under $108,650 could invite short entries toward $105,000.
While short-term caution dominates, Bitcoin’s broader structure still favors a retest of $130,000 later this year. Institutional inflows, corporate treasury accumulation, and its growing role as a hedge against inflation continue to strengthen the long-term thesis.
In other words, the current squeeze inside the
descending channel may define BTC’s next major leg, whether it’s the start of a deeper pullback or the foundation of a breakout rally that pulls Wall Street further into crypto.
Related Articles


