The Fibonacci indicator helps identify key support and resistance levels in crypto trading. Learn how to apply it on BingX charts for smarter trade setups.
The Fibonacci indicator is a trusted tool in technical analysis that helps crypto traders find areas where prices might reverse or consolidate. Based on the famous Fibonacci sequence, it highlights key retracement levels, like 23.6%, 38.2%, and 61.8%, that traders use to plan smarter entries and exits.
What Is the Fibonacci Indicator?
The Fibonacci indicator is a widely used tool in technical analysis that helps traders identify key price levels where a cryptocurrency might reverse or consolidate. It is based on the Fibonacci sequence, a mathematical pattern where each number is the sum of the two preceding ones. While this sequence has roots in nature, its application in trading lies in the ratios derived from it, such as 23.6%, 38.2%, 50%, and 61.8%. These percentages are used to map out potential retracement levels on a price chart.
In crypto trading, the Fibonacci retracement tool is used to analyze price movements during trends. For example, if Bitcoin rises from $20,000 to $30,000, traders can apply the Fibonacci tool to this range. The retracement levels will then indicate where the price might pull back before continuing its trend. A 38.2% retracement, for instance, would suggest a potential support level at $26,180.
What makes the Fibonacci indicator so valuable is its ability to provide structure in volatile markets like crypto. Instead of guessing where prices might reverse, traders can use these levels to plan their trades more effectively. For instance, a trader might decide to buy Bitcoin at the 50% retracement level, anticipating a bounce back to higher prices.
On BingX, the Fibonacci retracement tool is easy to use and can be applied to any cryptocurrency pair. By selecting a high and low point on the chart, traders can quickly visualize these levels and incorporate them into their strategies. This makes it an essential tool for traders aiming to navigate the unpredictable crypto market with precision.
Understanding the Fibonacci Technical Indicator: How Fibonacci Levels Work
Fibonacci levels are specific percentages derived from the Fibonacci sequence that traders use to identify potential price reversal zones in cryptocurrency charts. These levels act like invisible support and resistance zones where the price often reacts.
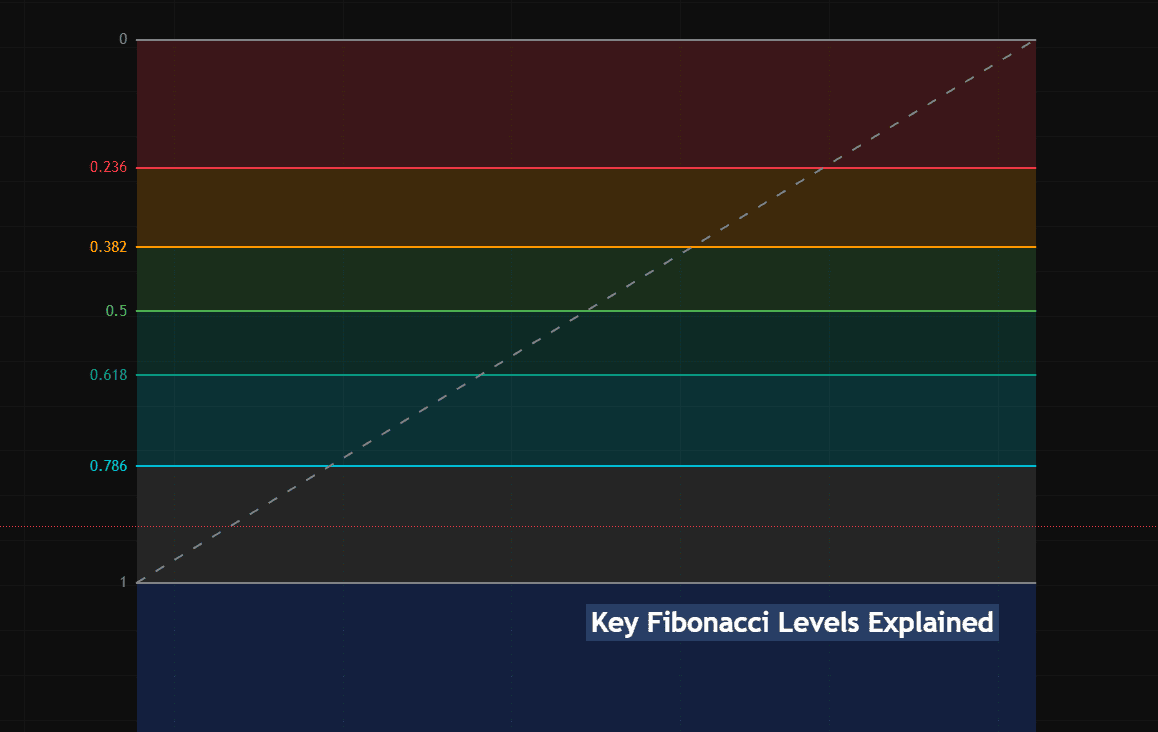 Source: BTC/USDT Trading Chart on BingX
The key Fibonacci retracement levels used in crypto trading are:
• 23.6% - A shallow retracement level indicating strong momentum in the original trend direction. When price only pulls back to this level before continuing, it suggests the primary trend (whether bullish or bearish) has significant strength.
• 38.2% - A moderate retracement level that serves as the first significant support or resistance zone. Many traders watch this level closely for potential trade entries.
• 50% - While not technically a Fibonacci number, this midpoint level is included because of its psychological importance and frequent price reactions.
• 61.8% - Known as the "golden ratio," this is considered the most important Fibonacci level. It often provides strong support or resistance and is a key decision point for many traders.
• 78.6% - A deeper retracement level that, when reached, might indicate a potential trend reversal rather than continuation.
The true value of Fibonacci levels lies in their simplicity. They don't predict exact price movements but highlight zones where traders should pay attention.
For example, if Bitcoin rises from $90,000 to $100,000, a pullback to the 38.2% Fibonacci level (around $96,180) becomes an area to watch for potential buying opportunities.
Why Is the Fibonacci Indicator Important for Crypto Traders?
Cryptocurrency markets are known for their volatility, and understanding price levels where the market might reverse or pause is important for making informed trading decisions. The Fibonacci indicator can provide traders with a clearer picture of where to place entry points, stop-loss orders, or profit targets.
The Fibonacci retracement tool is a powerful asset for crypto traders navigating volatile markets like Bitcoin, Ethereum, and altcoins. It helps identify potential support and resistance levels where price reversals or pauses are likely, allowing traders to make smarter entry, stop-loss, and take-profit decisions. Instead of relying on emotion or guesswork, Fibonacci levels bring structure to fast-moving market conditions.
For example, if Bitcoin drops from $100,000 to $90,000, the 38.2% retracement level near $93,820 may serve as a key resistance zone. By analyzing price action at such levels, traders can better time their trades and manage risk more effectively. On BingX, the Fibonacci tool is built into the platform, making it easy to apply this strategy to any asset and boost trading confidence.
How to Use the Fibonacci Indicator on BingX
Using the Fibonacci Retracement tool on BingX is a great way for new traders to spot areas where prices might reverse or continue. The tool helps identify support during a pullback in an uptrend or resistance during a bounce in a downtrend.
Here's how you can use it effectively:
Step 1: Open a Chart and Identify the Trend
Go to the BingX trading terminal and select your trading pair, let’s use BTC/USDT. If the market is trending up, look for the swing low (the recent bottom) and swing high (the recent top). These are your anchor points.
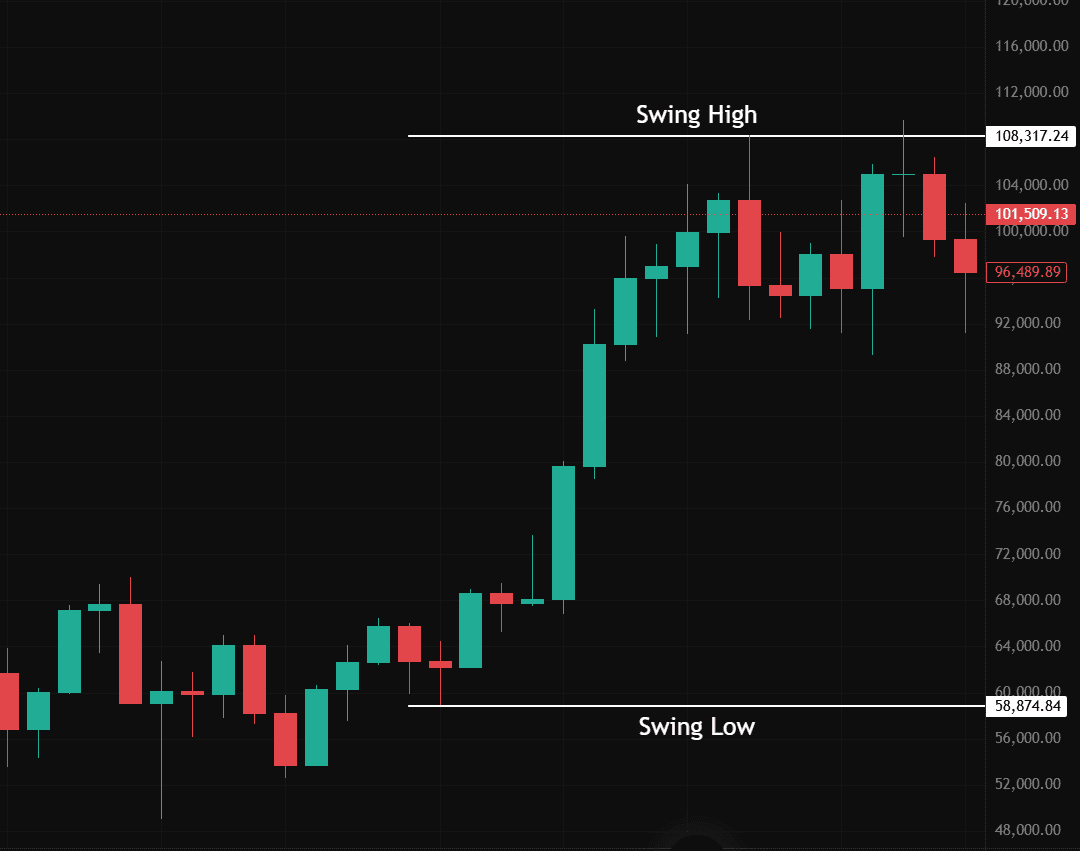 Source: BTC/USDT Trading Chart on BingX
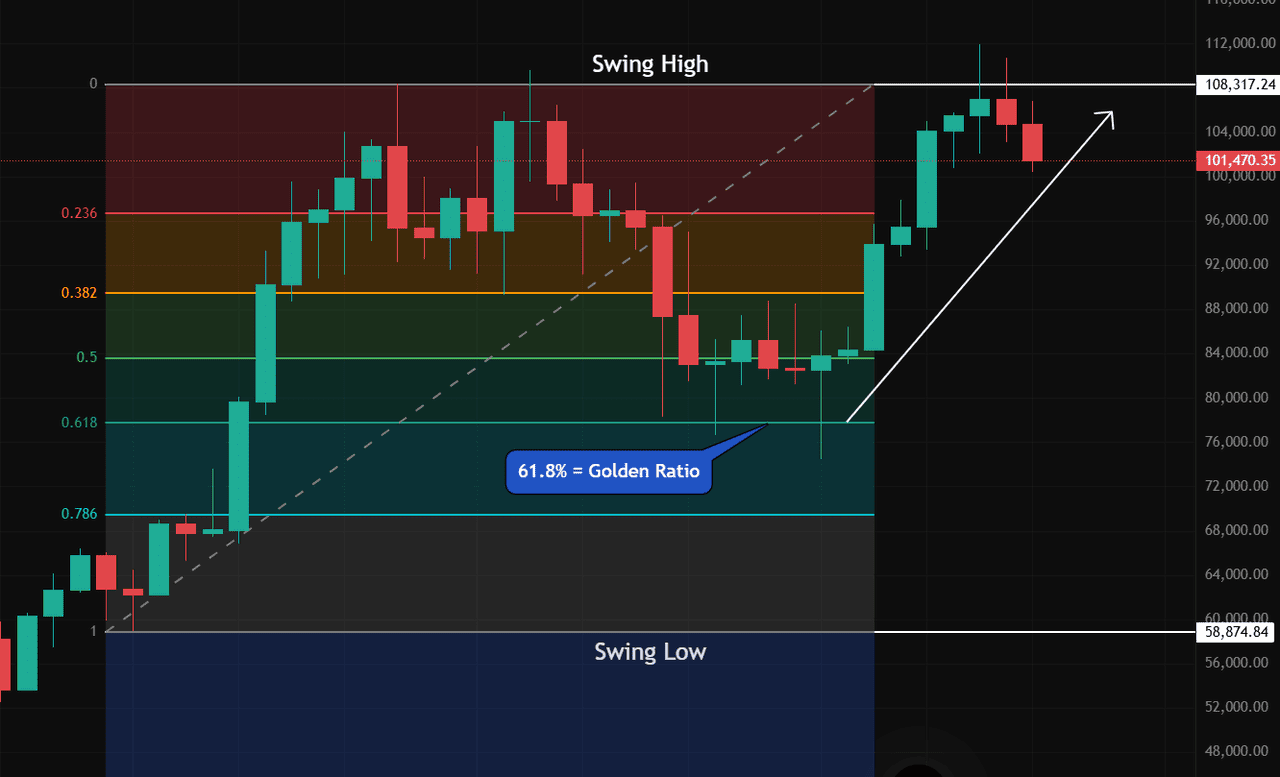
In the first image above, we’ve identified:
• Swing Low: Around $58,874
• Swing High: Around $108,317
Step 2: Select the Fibonacci Tool
From the left-hand menu on BingX charts, choose Fib Retracement. Click at the swing low, then drag and drop it at the swing high. This creates several horizontal lines across the chart, each representing a key level.
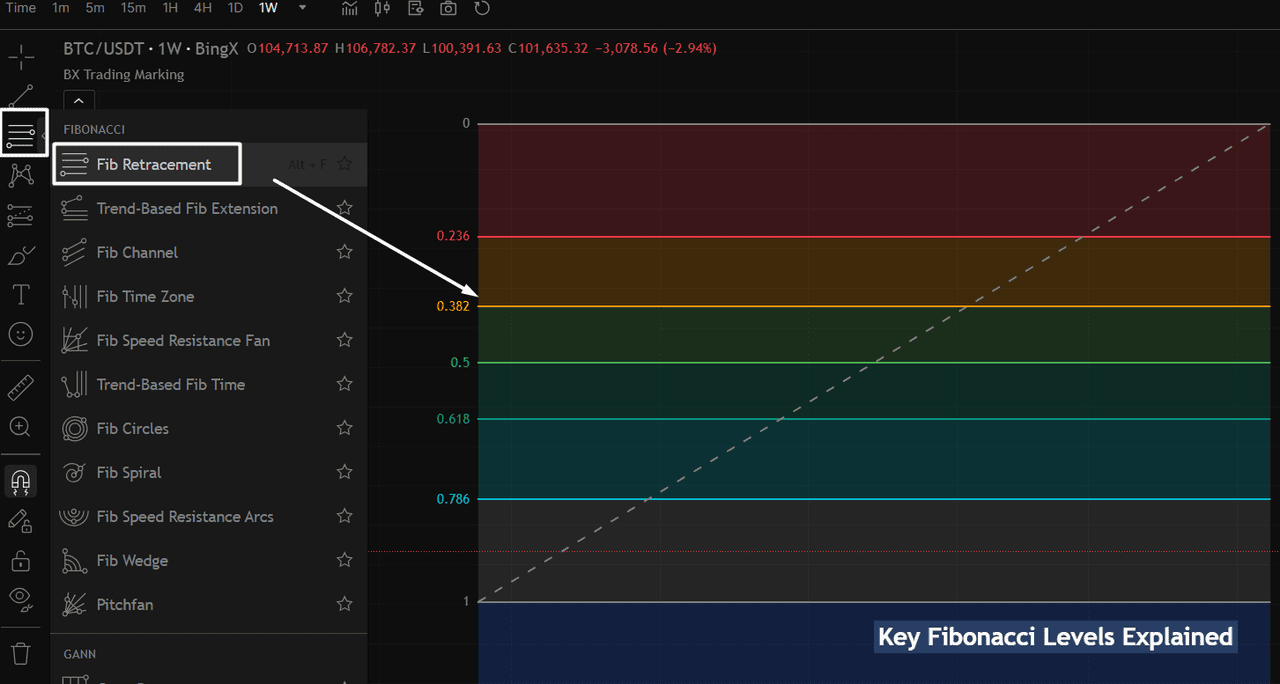 Source: BTC/USDT Trading Chart on BingX
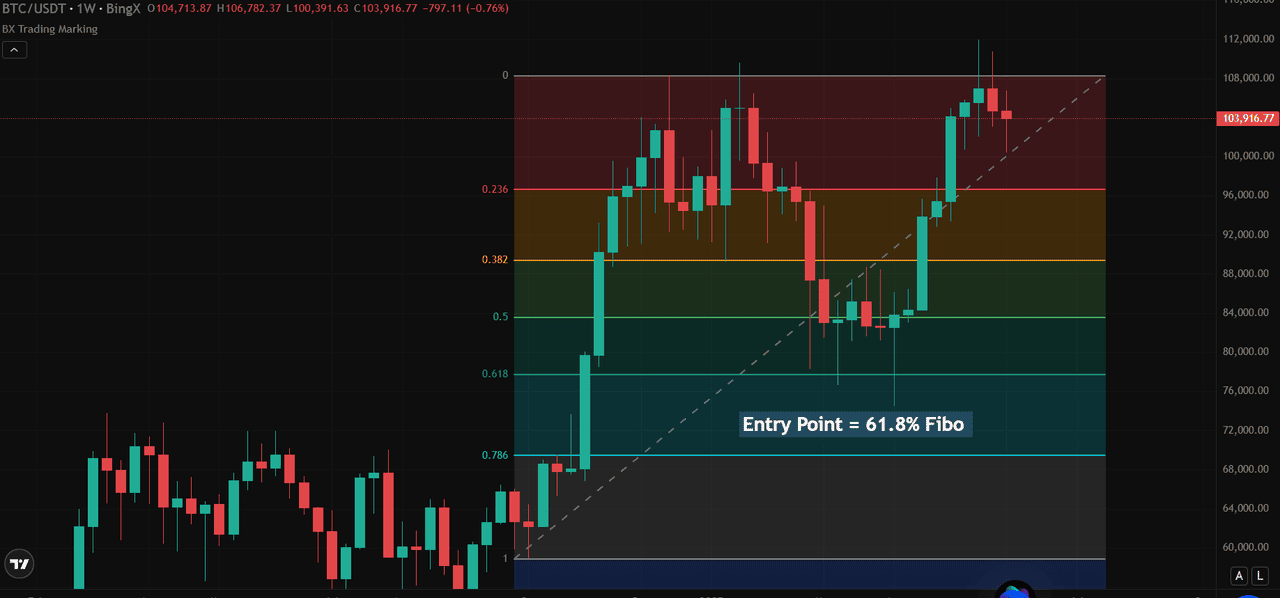
As shown in the chart, levels like 0.236, 0.382, 0.5, and 0.618 appear automatically. These are areas where the price may find support during a pullback.
Step 3: Watch Price Behavior Around Key Levels
In the chart below, BTC/USDT pulls back to the 0.618 level, also known as the “Golden Ratio” (61.8%). This is a common zone where price tends to reverse if the trend is strong.
 Source: BTC/USDT Trading Chart on BingX
Traders often:
• Look to buy near the 0.5 or 0.618 levels in an uptrend
• Set stop-losses slightly below these levels
• Target the previous high or a new breakout
Popular Fibonacci-Based Crypto Trading Strategies
These strategies work well for both day trading and swing trading; the concept remains the same. It's simply a matter of the timeframe you're analyzing. Whether you're looking at a 15-minute chart or a 1-week candle, Fibonacci levels help identify potential areas where price could reverse, pause, or resume its trend.
1. Fibonacci Pullback Strategy
This strategy waits for a clear price trend, either upward or downward, then looks for a pullback to a key Fibonacci retracement level, typically 38.2%, 50%, or 61.8%. These levels often act as strong support or resistance where trend continuation is likely to resume.
Trade idea: Enter trade when price bounces from one of these Fibonacci levels, ideally with confirmation from a bullish candlestick or a momentum indicator. For long trades, you’re looking for price to rebound from support; for short trades, a rejection from resistance.
 Source: BTC/USDT Trading Chart on BingX
For example, on the chart above, Bitcoin rallied from a swing low near $61,000 to a swing high around $108,000. It then pulled back to the 61.8% Fibonacci retracement level, approximately $79,000, which acted as a strong support zone. The price bounced off this level, offering a clean entry opportunity in line with the prevailing uptrend.
In such setups, traders can consider entering a long position near the 61.8% level, placing a stop-loss just below that mark to manage risk. A logical take-profit target would be the recent swing high, as price often revisits or tests that level if the trend resumes.
2. Fibonacci Pullback Strategy
The Fibonacci Breakout & Retest Strategy is used when price breaks through a key Fibonacci level (support or resistance), then returns to retest that level before continuing in the new direction. This strategy is popular because it allows traders to avoid chasing moves and instead wait for confirmation before entering.
 Source: BTC/USDT Trading Chart on BingX
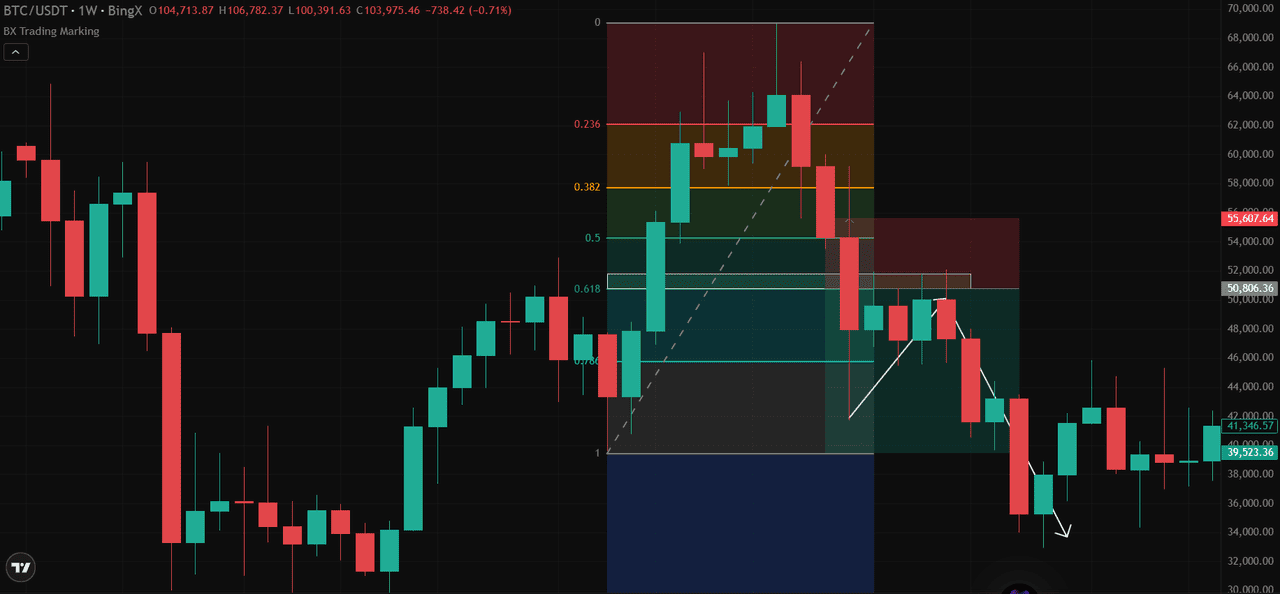
In the chart above, Bitcoin was trending upward before reversing its direction. As it retraced from the high, it broke below the 61.8% Fibonacci level, around $51,000, which had been acting as strong support.
What happened next:
• BTC bounced back up, retesting the 61.8% level.
• However, the price failed to close above it, turning that old support into new resistance.
• This confirmed a bearish breakout and retest, offering a potential short-selling opportunity.
Trade idea:
• Entry: After the retest candle closed below $51,000
• Stop-loss: Just above the 61.8% level
• Take-profit: At lower Fibonacci levels or the previous swing low near $40,000
This strategy works well in trending markets and helps traders enter trades with better risk-to-reward setups by waiting for confirmation, not just the breakout itself.
How to Combine Fibonacci with RSI, MACD, and Other Indicators
While Fibonacci retracement is powerful on its own for spotting potential support and resistance zones, it becomes much more effective when used alongside other technical indicators. These combinations can help you confirm whether a level is likely to hold or break, especially useful in crypto markets known for their volatility.
In our example below, we’re using the Relative Strength Index (RSI) to measure momentum, the Average Directional Index (ADX) to gauge the strength of the trend, and a 50-week Moving Average (MA) to track long-term price direction. These tools help confirm whether the Fibonacci levels are likely to hold.
However, you’re free to explore other popular indicators like the Stochastic Oscillator, Moving Average Convergence Divergence (MACD), Exponential Moving Averages (EMAs), or even volume-based indicators, depending on your trading style and preference.
 Source: BTC/USDT Trading Chart on BingX
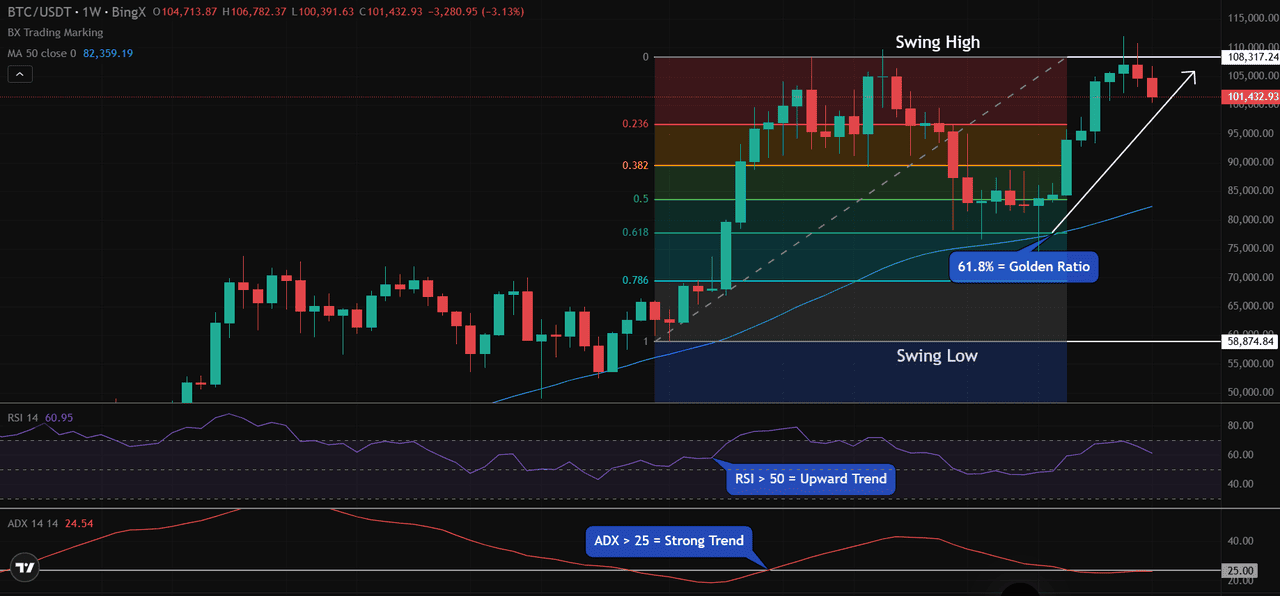
Let’s break down the BTC/USDT setup:
• Swing Low: $58,874
• Swing High: $108,317
• Pullback Level: 61.8% Fibonacci retracement, around $79,000
At this level:
• RSI was above 50 (60.95 to be precise), showing solid upward momentum
• 50-week MA sat at $82,359, acting as dynamic support
• ADX (14) was over 25, indicating a strengthening trend
All three signals aligned at an important level, enabling crypto traders to spot a high-probability bounce. Using multiple indicators doesn’t complicate your strategy—it clarifies it. When tools like RSI, ADX, and moving averages point in the same direction as Fibonacci levels, your trade setup gains strength and structure.
Conclusion
Fibonacci retracement is one of the most beginner-friendly yet effective tools in technical analysis. On BingX, you can apply it to any crypto chart, whether you're trading BTC, ETH, or altcoins, and instantly spot levels that matter. Try it today using the demo mode, combine it with RSI or moving averages, and start making more confident trading decisions. Practice using it with momentum and trend indicators like RSI, ADX, or Moving Averages to improve your accuracy.
Ready to see it in action? Open a BTC/USDT chart on BingX, and take the first step toward building smarter, more confident trading strategies.
Related Reading
5. Simple Moving Average(SMA) vs Exponential Moving Average(EMA) in Crypto Trading: Differences to Know
FAQs on Fibonacci Indicators
1. What is the Fibonacci indicator in crypto trading?
The Fibonacci indicator is a tool that helps traders identify key levels where price might retrace or bounce during a trend. These levels act as support or resistance zones.
2. Do Fibonacci levels work on all timeframes?
Yes, Fibonacci retracement can be used on any timeframe. However, higher timeframes like 4H, 1D, or weekly often provide more reliable signals.
3. Is Fibonacci retracement only for uptrends?
No. It works in both uptrends and downtrends. In an uptrend, it highlights pullback zones; in a downtrend, it shows potential resistance.
4. Can I use Fibonacci with other indicators?
Absolutely. It’s even more effective when combined with indicators like RSI, ADX, Moving Averages, or MACD to confirm trend strength or momentum.
5. How do I draw Fibonacci levels on BingX?
Simply open a chart, select the Fibonacci tool, and draw from a swing low to swing high (or high to low for downtrends). BingX will plot the key levels automatically.