Crypto markets move fast, and trend direction isn’t always easy to spot. For traders looking to stay ahead, understanding price movement beyond short-term volatility is essential. Moving averages help smooth out noise and reveal the underlying direction of the market. Among the most commonly used tools are the Simple Moving Average (SMA) and the Exponential Moving Average (EMA).
Both are available on BingX and serve different trading needs. While one responds quickly to price shifts, the other offers a broader view of long-term trends. Knowing how and when to use each can improve timing, reduce noise, and strengthen your overall trading setup.
Key Takeaways
• SMAs smooth long-term trends and highlight support or resistance in trending markets.
• EMAs react more quickly to price changes and help generate short-term signals.
• Both are widely used in crypto to improve entries, exits, and trend confirmation.
What Are Moving Averages in Crypto?
Moving averages are essential tools in crypto trading, helping smooth out price fluctuations and reveal trend direction more clearly. Among the different types, the Simple Moving Average (SMA) and Exponential Moving Average (EMA) are the most widely used by both short- and long-term traders.
Both measure the average price over a fixed period, such as 7, 20, 50, 100, or 200 days. The key difference lies in how they handle recent data, which can significantly impact decision-making in volatile markets.
In crypto trading, moving averages serve three key purposes:
• Trend identification: They help determine if the market is trending up, down, or sideways
• Support and resistance: They often act as dynamic zones where the price reacts
• Signal generation: Crossovers can indicate possible entry or exit points
Understanding how SMAs and EMAs differ allows traders to filter noise, gauge momentum, and choose strategies that match market speed.
What Is a Simple Moving Average (SMA)?
A Simple Moving Average, or SMA, calculates the average closing price of cryptocurrency over a set number of periods. For example, a 50-day SMA takes the closing prices of the last 50 days, adds them together, and divides them by 50. Each day’s value carries equal weight in the calculation.
Formula: SMA = (Sum of closing prices over N periods) ÷ N Where N is the number of periods (e.g., 50, 100, 200)
SMAs are commonly used by swing traders and long-term investors who want to understand broader market direction without being distracted by daily volatility. They are especially helpful for spotting long-term support and resistance levels in trending markets.
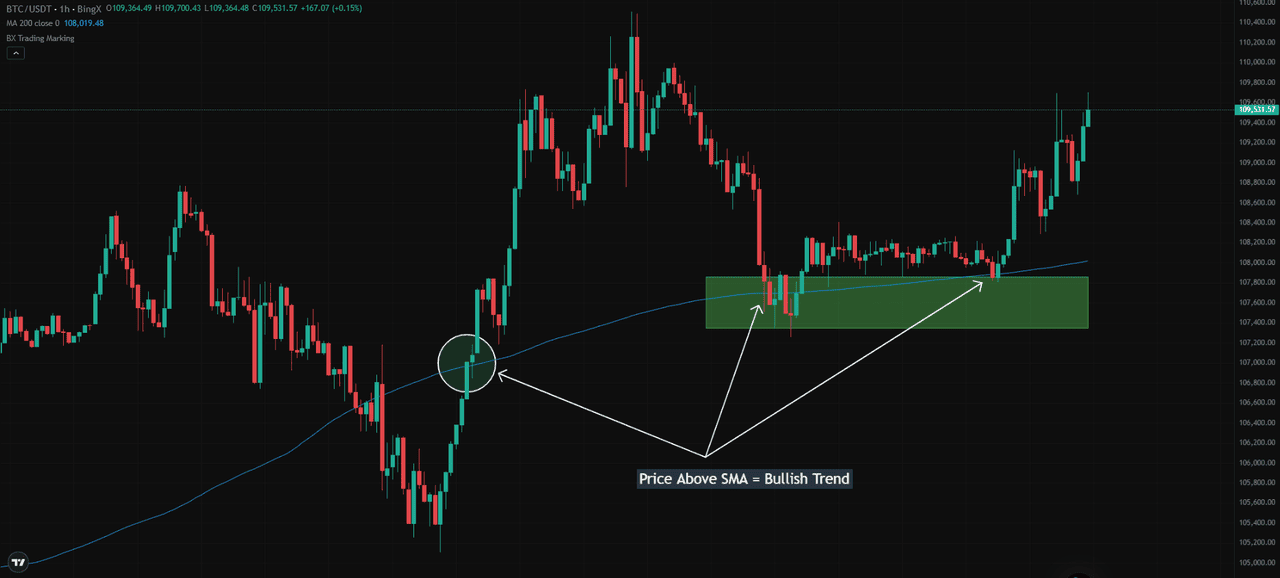
Source: BTC/USDT Trading Chart on BingX
For example, some traders on BingX may use the 200-day SMA on a BTC/USDT chart to assess the broader trend. If the price stays above this line, it can reflect longer-term bullish sentiment. A breakdown below it may suggest a shift toward bearish conditions or trend exhaustion.
Read more: Understanding Simple Moving Average (SMA)
What Is an Exponential Moving Average (EMA)?
An Exponential Moving Average, or EMA, calculates the average price over a set period like an SMA, but with more weight given to recent prices.
The most recent closing price has a higher influence, often between 10 and 20 percent in shorter timeframes, such as the 9-day or 21-day EMA. This makes the EMA more responsive to current market conditions.
The formula uses a smoothing factor: EMA = (Price × Multiplier) + (Previous EMA × (1 − Multiplier)) Where Multiplier = 2 ÷ (Period + 1)
EMAs are popular among short-term crypto traders who want faster signals for entries and exits. They are instrumental in volatile altcoin markets, where swift reaction times are crucial.
For example, traders may use the 9-EMA and 21-EMA on a BTC/USDT or ETH/USDT chart to spot momentum shifts. A crossover, where the 9-EMA moves above the 21-EMA, can act as a bullish signal. When the 9-EMA falls below the 21-EMA, it may suggest weakening trend strength or a potential reversal.
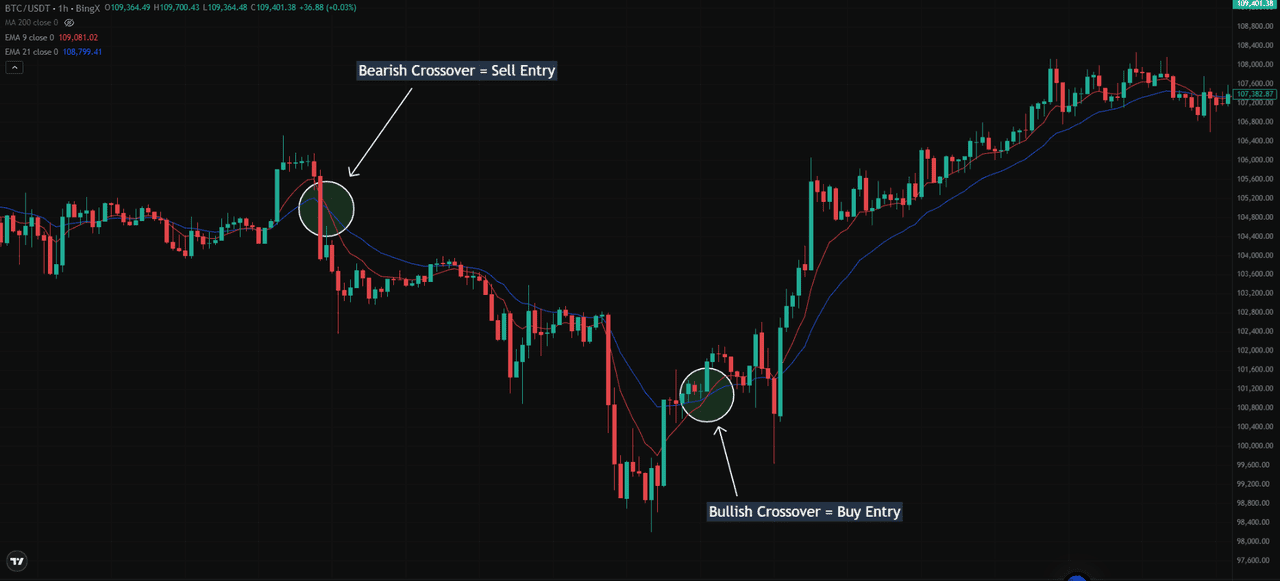
Source: BTC/USDT Trading Chart on BingX
In the BTC/USDT 1-hour chart above, a bearish crossover occurred near $105,000, where the 9-EMA crossed below the 21-EMA, typically indicating a sell signal.
Later, a bullish crossover near $101,000 indicated that the 9-EMA had crossed back above, offering a potential buy entry as momentum shifted.
SMA vs. EMA: What’s the Difference in Crypto Trading?
Although both SMA and EMA help traders identify trends, they are built for different trading needs. Understanding how they behave in crypto markets can help you choose the right tool or use both together for a more complete view.
1. Method of Calculation
The SMA takes the average of closing prices over a set number of candles and gives each one equal weight. In contrast, the EMA gives more weight to the most recent prices, which makes it respond faster to current market conditions.
2. Speed and Sensitivity
The EMA is more sensitive to price changes and better suited for short-term strategies. For example, when trading volatile pairs like DOGE/USDT or SOL/USDT, the EMA reacts quickly to price swings, helping short-term traders catch breakouts or reversals early. The SMA responds more slowly, which helps filter out minor fluctuations and confirms broader trends.
3. Trend Reversals and Timing
If you rely on early trend signals, EMA crossovers are a common method for identifying them. For instance, when the 9-EMA crosses above the 21-EMA on BTC/USDT, it may indicate building bullish momentum.
On the other hand, SMA crossovers (such as the 50-SMA crossing above the 200-SMA, known as a Golden Cross) are slower but more reliable for confirming sustained market shifts.
4. Volatility Handling
In fast-moving crypto markets, EMAs can give early signals but may also produce more false alarms during sideways price action. SMAs smooth out short-term spikes, making them more stable but slower to respond. This makes SMAs better for confirming trend direction in high-timeframe strategies, like swing trading or position holding.
5. Strategy Alignment
Use EMAs when you’re scalping or day trading, especially with altcoins that move quickly. Use SMAs when analyzing long-term trends in Bitcoin or Ethereum, where confirmation is more valuable than speed.
Top Crypto Trading Strategies Using SMAs and EMAs
Now that we’ve explored how SMAs and EMAs work individually, let’s look at how traders on BingX apply these tools in live setups.
1. Golden Cross (50 SMA > 200 SMA)
The Golden Cross occurs when the 50-period Simple Moving Average (SMA) crosses above the 200-period SMA. This event is often used to assess potential shifts from bearish to bullish market conditions. While slower to develop, it’s commonly referenced in swing and position trading.
On the BTC/USDT 1-hour chart, a Golden Cross formed near $107,100, where the 50-SMA (yellow) moved above the 200-SMA (blue). After the crossover, price advanced toward $110,500.
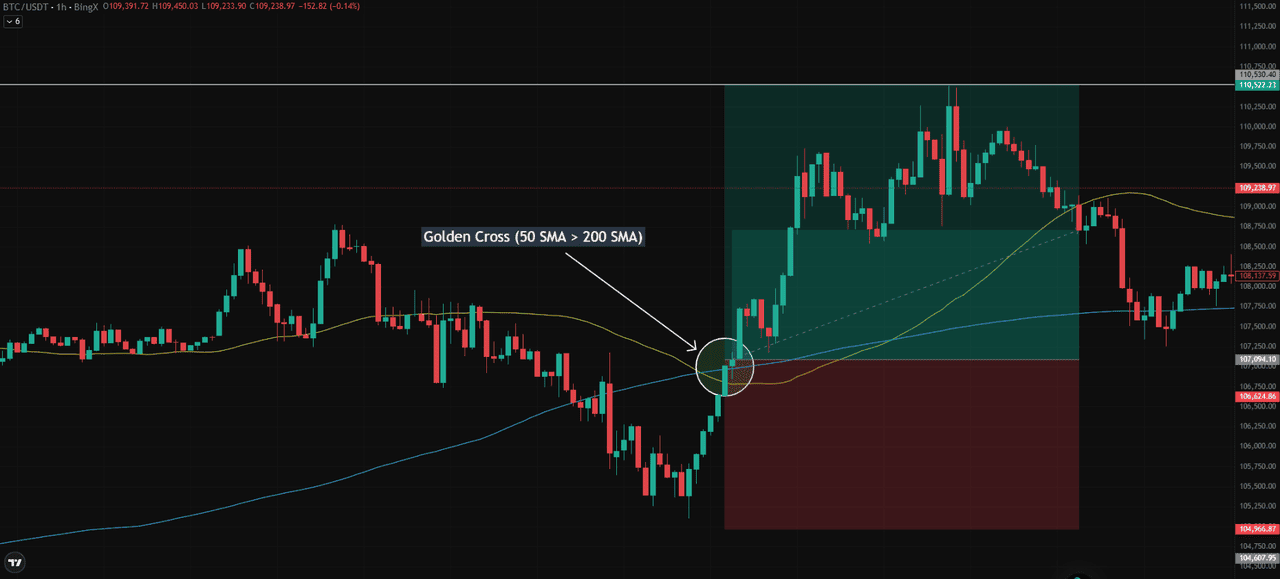
Source: BTC/USDT Trading Chart on BingX
Risk Management Examples:
• Take Profit: Set near the next resistance level, in this case, around $110,500
• Stop Loss: Place just below the recent low, near $104,400
Compared to EMA strategies, the Golden Cross offers a steadier signal. Some traders pair it with faster EMA crossovers to improve timing while staying aligned with long-term momentum.
2. EMA Crossover for Entry Signals (e.g., 9/21 EMA)
The 9-EMA and 21-EMA crossover strategy is frequently used for short-term decision-making. When the 9-EMA crosses below the 21-EMA, it may suggest building bearish pressure. Traders often wait for confirmation, such as a candle closing below both EMAs, before acting.
For take profit, you have two common options:
• Conservative: Close the trade at the nearest support level, where a bounce is likely.
• Extended: Hold until a bullish crossover appears, signaling momentum has shifted.
The same logic applies to long trades when the 9-EMA crosses above the 21-EMA.
For longer-term trend confirmation, some traders also track Golden Cross setups, where the 50-day SMA moves above the 200-day SMA, often marking a broader uptrend.
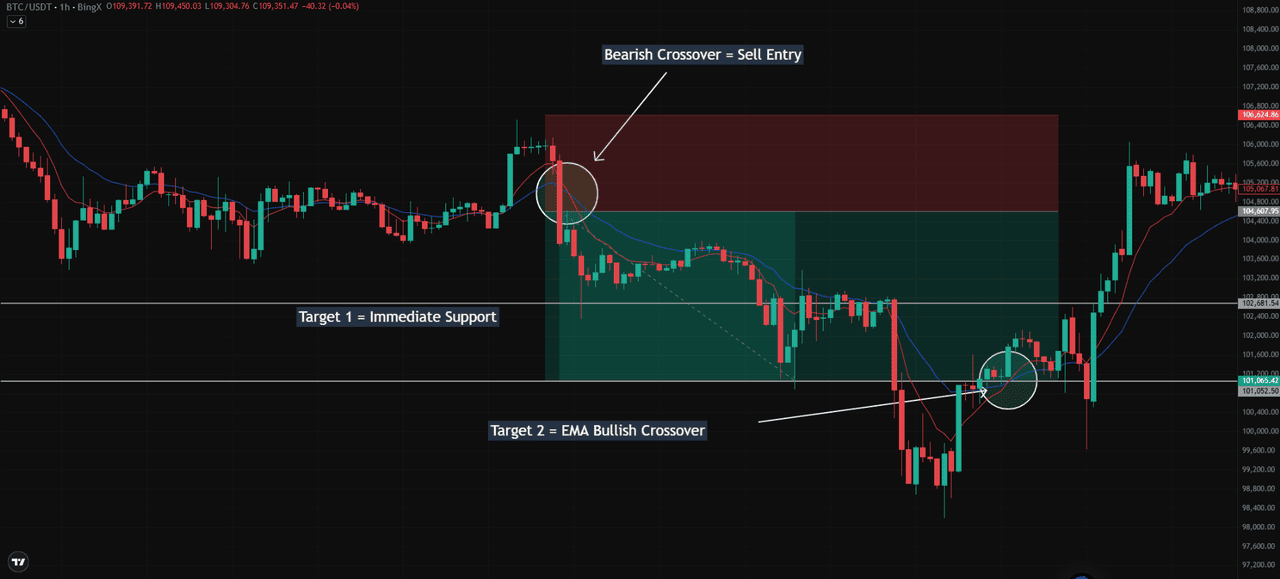
Source: BTC/USDT Trading Chart on BingX
In the example above, a bearish crossover occurs around $106,800, where the 9-EMA (red) crosses below the 21-EMA (blue). Rather than entering instantly, experienced traders wait for confirmation, such as a full candle closing below both EMAs, which happens near $105,700. This confirms bearish momentum and marks a potential sell entry.
Once in the trade, there are two profit-taking approaches:
• Target 1: Exit near the next support, such as $102,680
• Target 2: Hold until a bullish crossover occurs (e.g., 9-EMA crossing back above 21-EMA), which in this case happened near $101,060
This same method applies in bullish conditions. When the 9-EMA crosses above the 21-EMA and price closes above both, it often sets up a long entry.
3. Using SMAs and EMAs Together for Trend Confirmation
Rather than using one in isolation, many traders combine short-term EMAs with long-term SMAs to enhance clarity. EMAs react quickly and can highlight potential entry zones. SMAs confirm broader direction.
One effective approach:
• a 9/21 EMA crossover to identify a trade
• Check whether it occurs above (bullish) or below (bearish) a longer SMA like the 200-SMA
For example, a bullish crossover forming above a rising 200-SMA offers stronger confirmation. A bearish crossover below a falling SMA adds downside conviction.
This combined method can help:
• Stay aligned with the primary trend
• Avoid low-probability setups
• Reduce noise from short-term volatility
How to Use SMAs and EMAs on BingX
1. To apply a Simple Moving Average (SMA) or Exponential Moving Average (EMA) on BingX, open any crypto chart and tap the “Indicators” icon.
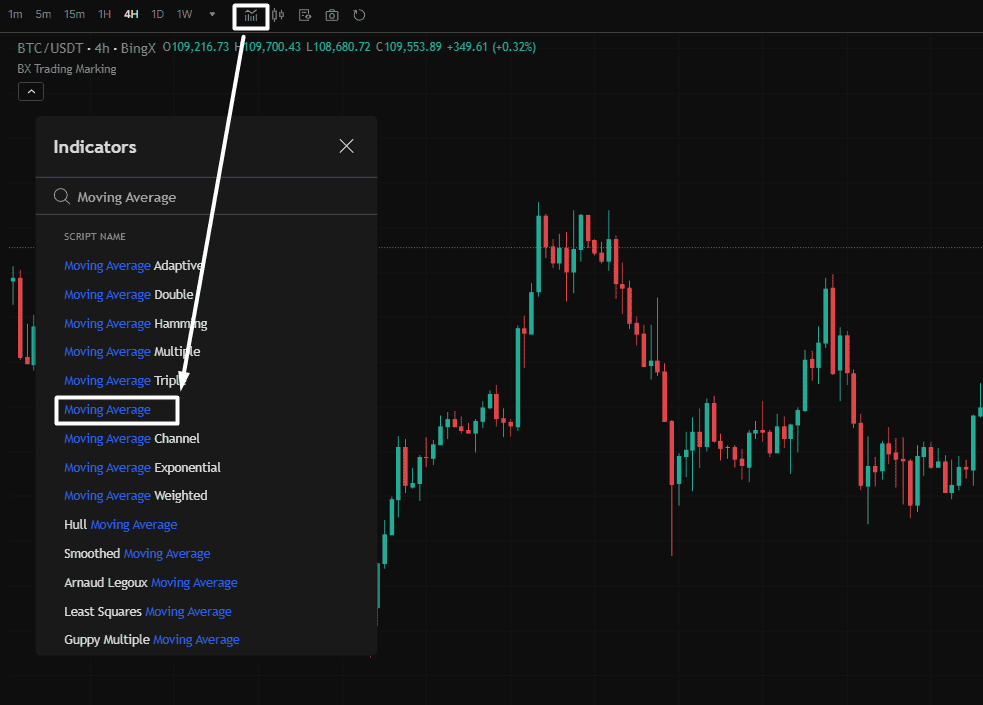
Source: BTC/USDT Trading Chart on BingX
2. Search for “Moving Average” for SMA or “Exponential Moving Average” for EMA. You can adjust the period (such as 9, 21, 50, or 200) to match your trading strategy.
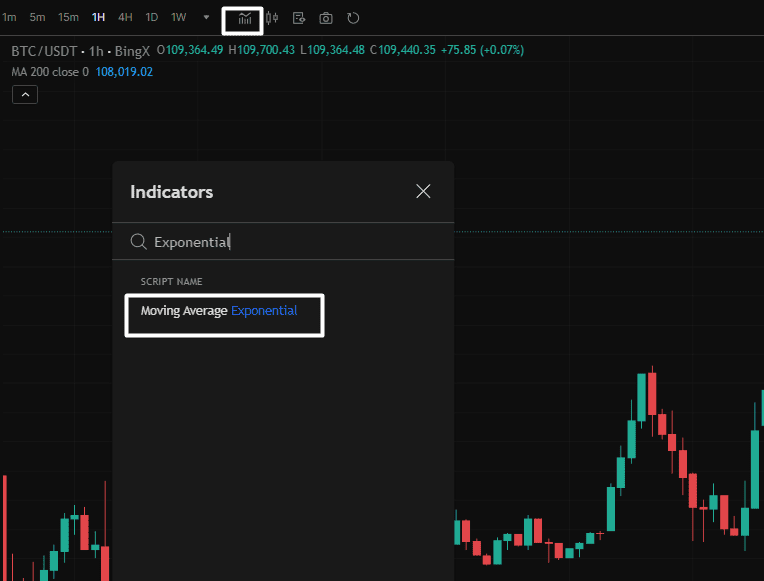
Source: BTC/USDT Trading Chart on BingX
BingX also allows you to combine these with other tools, such as the Relative Strength Index (RSI) for momentum or the Moving Average Convergence Divergence (MACD) for trend confirmation. Whether on mobile or desktop, BingX charts offer an intuitive layout with customizable indicators and real-time data to support fast and informed trading decisions.
Conclusion
Simple Moving Averages (SMAs) offer a stable view of long-term trends, while Exponential Moving Averages (EMAs) react faster to short-term price action. Each has its role in crypto trading. Before trading live, test both on BingX charts to see what fits your style. Combining EMAs and SMAs can enhance trade timing, but always use them with proper risk management and clear strategy planning.
Related Reading
FAQs on SMAs and EMAs
1. What’s the difference between a Simple Moving Average (SMA) and an Exponential Moving Average (EMA)?
An SMA gives equal weight to all prices in a selected period, creating a smoother trend line. An EMA gives more weight to recent prices, making it more responsive to current market changes.
2. Which is better for crypto trading: SMA or EMA?
It depends on your strategy. EMAs are more suitable for short-term trading or volatile altcoins. SMAs are better for long-term trend confirmation and filtering out short-term price noise.
3. What does a 9 EMA and 21 EMA crossover mean?
When the 9 EMA crosses above the 21 EMA, it can signal a potential buy setup. If it crosses below, it may indicate a sell or bearish momentum shift.
4. What is the Golden Cross in crypto trading?
A Golden Cross occurs when the 50-day SMA crosses above the 200-day SMA. It typically signals a long-term bullish trend and is used in swing or position trading.
5. How can I apply SMAs and EMAs on BingX charts?
Click on “Indicators” in any BingX trading chart, search for “Moving Average” or “Exponential Moving Average,” and adjust the period to suit your strategy. You can also pair them with RSI or MACD for stronger signals.