In financial markets, price movement alone rarely tells the full story. Traders also watch volume flow, the amount of an asset bought or sold over time, to gauge the strength of a trend. As the saying goes, “volume precedes price movement.” When trading activity surges before price reacts, it often signals that momentum is building.
This concept is especially relevant in the cryptocurrency market, where volatility is extreme and market sentiment shifts quickly. Among the most reliable tools to track this hidden activity is the On-Balance Volume (OBV) indicator. By condensing trading activity into a single line, OBV makes it easier to spot whether buying or selling pressure is driving the market.
For traders seeking valuable insights, OBV can help confirm trends, anticipate reversals, and support more informed trading decisions.
What Is OBV (On-Balance Volume) and How Does It Work?
The On-Balance Volume (OBV) indicator is a momentum tool introduced by market analyst Joseph Granville in 1963. Its purpose is to track how trading volume flows in or out of an asset and how that flow relates to price movements. In simple terms, OBV shows whether buying or selling pressure is driving the market.
The logic is straightforward:
• If an asset closes higher than the previous day’s close, that day’s volume is treated as buying pressure and added to the OBV line.
• If the close is lower than the previous day’s close, the day’s volume is considered selling pressure and subtracted from OBV.
• If the closing price is unchanged, OBV remains the same.
Formula:
When an asset closes above the previous day’s price, OBV is calculated as:
OBV = Previous OBV + Current Day’s Volume
When the closing price is unchanged from the prior day, OBV remains the same:
OBV = Previous OBV (+ 0)
When an asset closes below the previous day’s price, OBV is adjusted as:
OBV = Previous OBV – Current Day’s Volume
Key terms:
• Previous OBV – the running cumulative total carried forward from the prior period.
• Today’s Volume – the current day’s total trading activity.
• Previous Close – the last session’s closing price, used for comparison.
Over time, this creates a cumulative indicator that reveals whether money is flowing into an asset (rising OBV = strong buying pressure) or out of it (falling OBV = strong selling pressure). For traders, OBV becomes a valuable tool to confirm price trends, detect weakening momentum, and anticipate possible trend reversals.
Why Is OBV Relevant for the Cryptocurrency Market?
The cryptocurrency market is known for its extreme volatility and rapid price movements. Prices can surge or drop within hours, often leaving traders questioning whether the move is driven by real demand or simply short-term speculation. This is where the On-Balance Volume (OBV) indicator proves especially valuable.
OBV helps filter out noise by showing whether buying and selling pressure is truly supporting a price move.
• If prices rise while OBV increases, it confirms a bullish trend fueled by strong demand.
• If prices fall while OBV decreases, it validates a bearish trend with heavy selling pressure.
• If price and OBV diverge, it may indicate a potential reversal on the horizon.
For crypto traders, these insights are valuable because they reveal whether whales, institutions, or retail participants are actually backing the move. OBV is rarely used alone; it is often combined with indicators like moving averages, Relative Strength Index (RSI), and Moving Average Convergence Divergence (MACD) to confirm strength, momentum, and potential entry or exit points.
By pairing OBV with complementary tools, traders can better separate genuine market trends from short-lived volatility, ultimately making more informed trading decisions in crypto’s fast-paced environment.
How to Read the OBV Line
The On-Balance Volume (OBV) indicator helps traders see whether buying or selling pressure is driving price movements in the crypto market. It’s built using a simple rule: if an asset closes higher than the previous day, the day’s trading volume is added to OBV. If it closes lower, that volume is subtracted. If the closing price is unchanged, OBV stays the same. Over time, this creates a compounding indicator that reflects the cumulative flow of volume behind price action.
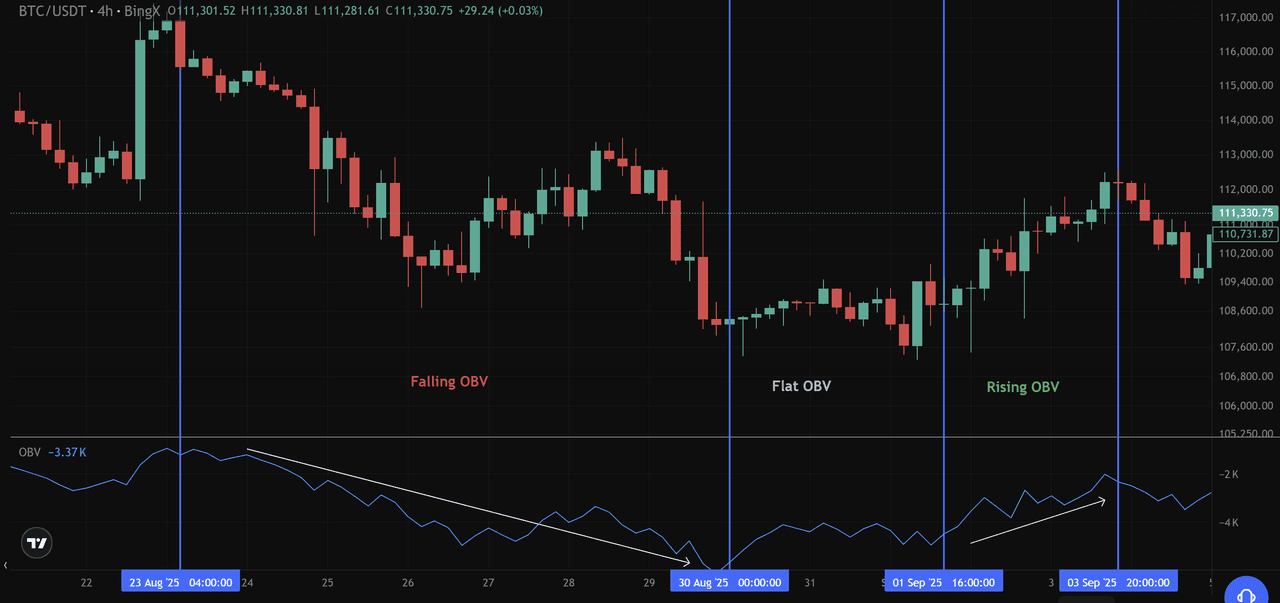
OBV Indicator on Bitcoin Price Chart - Source: BingX
Here’s how to interpret what’s happening:
• Rising OBV: Around September 1st–4th, the OBV line moves upward while Bitcoin’s price also pushes higher. This signals intense buying pressure, supporting the idea of a bullish trend. When OBV rises in tandem with the price, it confirms that the upward move is supported by genuine market volume.
• Falling OBV: Notice the OBV decline during the late August sell-off. Even when the price briefly bounced, the falling OBV showed intense selling pressure dominating the market. This warned traders that the downward trend was still intact.
• Flat OBV: Between August 30th and September 1st, OBV stayed relatively flat while Bitcoin’s price consolidated sideways near $111,000. A flat OBV line indicates that the market is in a state of consolidation, with neither buyers nor sellers holding a clear advantage.
How to Use OBV Indicator to Spot Bullish and Bearish Divergences
One of the most powerful ways to use the On-Balance Volume (OBV) indicator is to look for divergences between price and the OBV line. A divergence happens when the two move in opposite directions, often signaling that the current trend is losing strength and a reversal could be near.
Bullish Divergence
A bullish divergence happens when the price moves downward, but the On-Balance Volume (OBV) line rises. This creates a mismatch between price action and volume flow. While price appears weak on the chart, OBV shows that buying pressure is quietly increasing, often signaling a potential trend reversal to the upside.
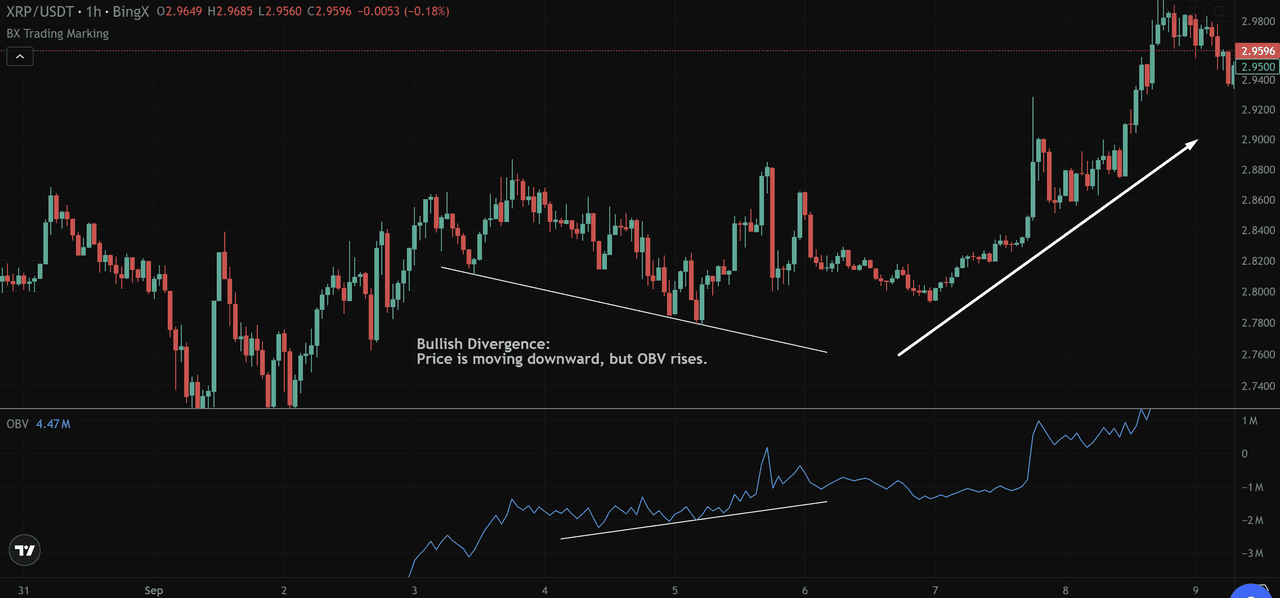
XRP Price Chart, Bullish Divergence via OBV Indicator - Source: BingX
In the XRP/USDT 1-hour chart above, you can see this setup in action:
• Between September 2 and September 5, XRP’s price drifted lower, falling from around $2.92 to $2.77. At first glance, this looked like a standard downward trend.
• But at the same time, the OBV line was rising steadily, showing that more trading volume was flowing into XRP despite the price drop. This meant smart money or institutional investors could have been accumulating while retail traders were selling.
• Soon after this divergence, XRP reversed sharply, rallying from $2.77 up to $2.96. The rising OBV had already hinted that selling pressure was weakening and that an upward breakout was likely.
Bearish Divergence
A bearish divergence occurs when the price climbs, but the On-Balance Volume (OBV) line falls. This shows that the rally isn’t backed by strong buying pressure. Instead, demand is weakening, and the uptrend may soon run out of steam, leading to a possible downward reversal.
How to Combine OBV with Other Technical Indicators
While OBV is powerful on its own, it becomes even more effective when combined with other technical indicators. Pairing OBV with tools like RSI and MACD helps traders confirm whether a price move is backed by genuine volume flow and market momentum, reducing the risk of false signals.
1. Combining OBV with RSI
The On-Balance Volume (OBV) indicator tracks buying and selling pressure, while the Relative Strength Index (RSI) measures momentum and overbought/oversold conditions. Used together, they help confirm whether price moves are supported by real demand.
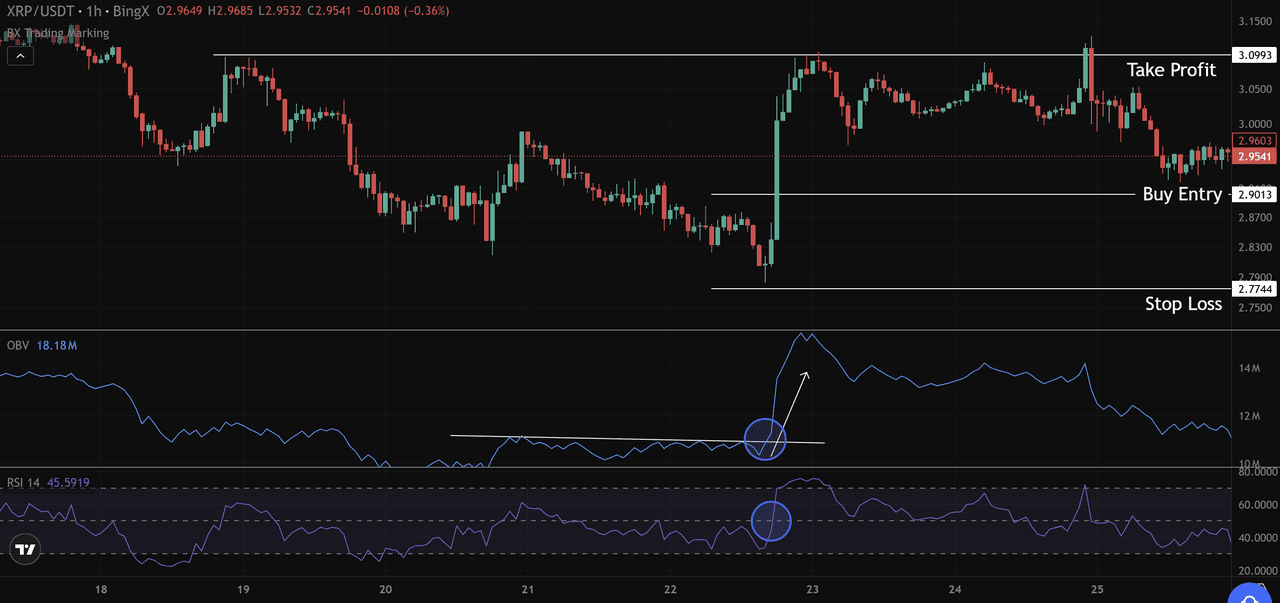
XRP Price Chart, OBV Indicator with RSI - Source: BingX
In the XRP/USDT chart above, OBV breaks upward while RSI rebounds from oversold near 30 and crosses above 50. This dual signal confirmed strong buying pressure and gave traders confidence to enter near $2.90, with targets around $3.09 and a stop at $2.77.
2. Combining OBV with MACD
The OBV indicator reveals whether buying or selling pressure supports price moves, while the Moving Average Convergence Divergence (MACD) tracks momentum shifts and trend strength. Together, they help confirm when a reversal is genuine.
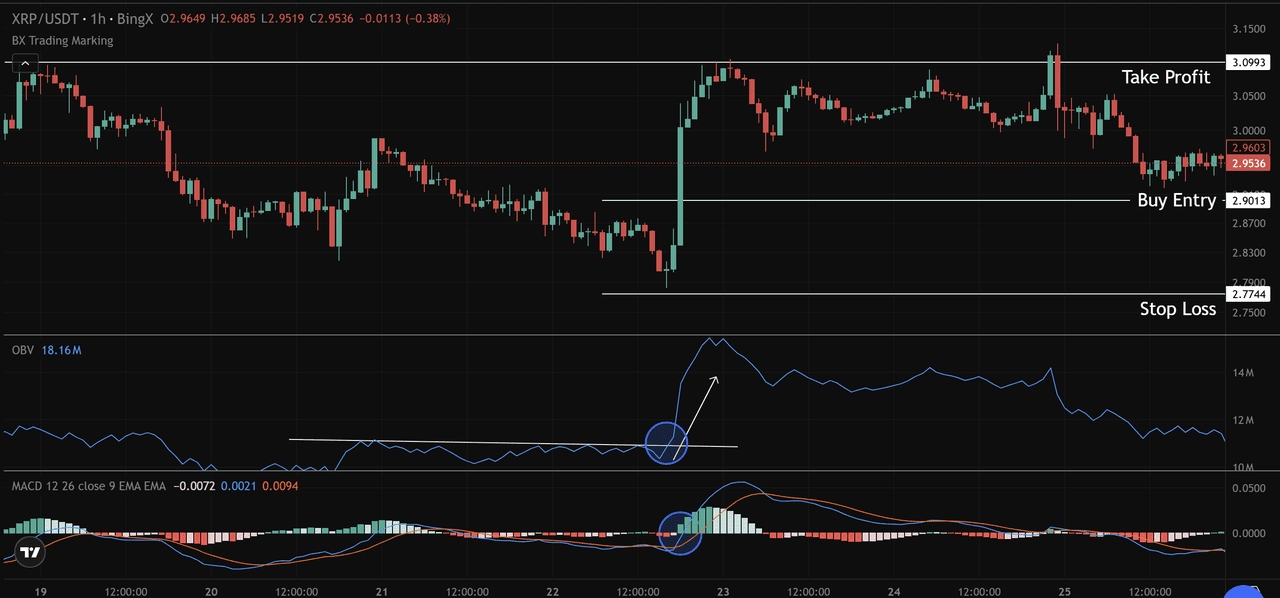
XRP Price Chart, OBV Indicator with MACD - Source: BingX
In the XRP/USDT chart above, OBV surged upward while the MACD lines crossed bullish with green histogram bars expanding. This dual confirmation signaled strong buying pressure and momentum, supporting a long entry near $2.90 with a target at $3.09 and stop around $2.77.
3. Support and Resistance with OBV and MACD
Support and resistance zones act like market barriers where buyers or sellers dominate. Resistance serves as a ceiling where rallies often stall, while support is a floor where declines tend to pause.
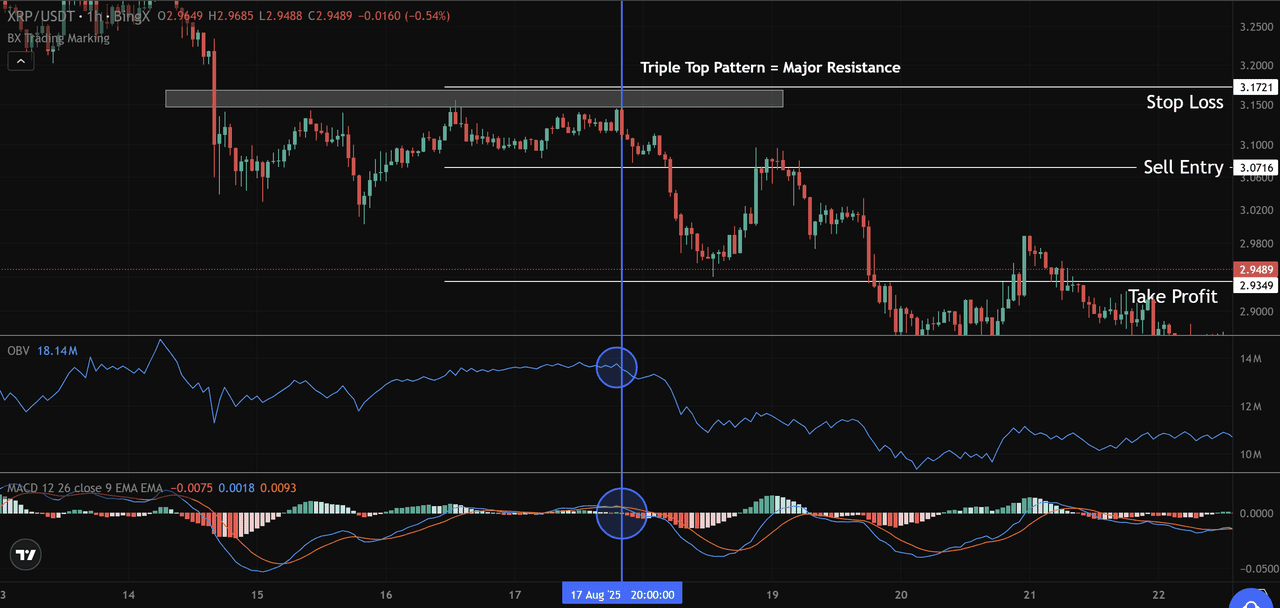
XRP Price Chart, Support/Resistance with OBV + MACD – Source: BingX
In the XRP/USDT chart above:
• A triple top pattern formed near $3.17, creating major resistance. Each attempt to break this level failed, confirming strong seller control.
• A sell entry was set at $3.07, just below resistance, after OBV began trending lower and MACD flashed a bearish crossover, signaling weakening momentum.
• The take profit target was placed at $2.93, a previous support area where prices had bounced before.
• A stop-loss was maintained above $3.17 to protect against a breakout.
Here, OBV revealed declining volume flow at resistance, while MACD confirmed fading momentum, together strengthening the case for a downward move.
What Are the Strengths and Limitations of OBV Technical Indicator?
The On-Balance Volume (OBV) indicator is a popular tool in crypto trading, but like any technical indicator, it has both advantages and drawbacks. Knowing these helps traders apply OBV more effectively and avoid common mistakes.
Strengths:
• Simple yet powerful: OBV is easy to calculate and interpret, making it accessible even for beginners.
• Effective in volatile crypto markets: Because crypto often sees sharp price swings, OBV’s ability to track volume flow gives traders a clearer view of real buying and selling pressure.
• Institutional insight: OBV can reveal hidden activity from institutional investors, since large trades often leave clear footprints in volume data.
• Better decisions: By confirming trends or spotting divergences, OBV helps traders make more informed trading decisions.
Limitations:
• Prone to false signals: Sudden spikes in trading volume (like news-driven pumps or whale activity) can distort the OBV line.
• No exact entries/exits: OBV shows pressure and momentum but doesn’t pinpoint the best time to buy or sell.
• Needs confirmation: It works best when combined with other indicators like RSI, MACD, or moving averages to filter out noise.
Conclusion: OBV as a Valuable Tool in Crypto
The On-Balance Volume (OBV) indicator is more than just a line on a chart, it’s a powerful way to track the buying and selling pressure that drives crypto price movements. By combining price and volume data, OBV provides traders with a clearer picture of market sentiment, helping them cut through the noise of volatile price action.
Its ability to confirm trends and spot divergences before they fully play out makes it an essential tool for anyone serious about crypto trading. While OBV is not foolproof, sudden spikes in volume can create false signals; however, it remains one of the most effective and reliable momentum indicators when used in conjunction with other tools, such as RSI or MACD.
In fast-moving markets like cryptocurrency, where timing and confidence are crucial, OBV provides traders with valuable insights to make better-informed decisions and stay ahead of potential reversals.
Related Reading
FAQs on On-Balance Volume (OBV) Indicator
1. What is OBV in crypto trading?
On-Balance Volume (OBV) is a technical indicator that tracks buying and selling pressure by combining price movement with trading volume. It helps traders see whether volume supports a price trend.
2. How does OBV help confirm market trends?
If both price and OBV are rising, it confirms a bullish trend backed by strong buying pressure. If both are falling, it supports a bearish trend with strong selling pressure.
3. Can OBV predict price reversals?
Yes. When OBV diverges from price (e.g., price falls but OBV rises), it can signal weakening momentum and a possible trend reversal.
4. What’s the difference between OBV and moving averages?
OBV focuses on volume flow to measure market sentiment, while moving averages smooth out price action to show trend direction. Many traders use both together for stronger signals.
5. Should I use OBV alone or with other technical indicators?
OBV works best when combined with tools like RSI, MACD, or moving averages. Using it alongside other indicators helps reduce false signals and improves trading accuracy.