Volatility is the lifeblood of crypto trading. Unlike traditional markets, where stocks and bonds often move within defined ranges, digital assets like Bitcoin and Ethereum are notorious for sudden swings. These sharp moves create both opportunities and risks, making volatility one of the most closely tracked features of the crypto market.
In traditional finance, the Chicago Board Options Exchange (CBOE) developed the Volatility Index, or VIX, often referred to as the “fear index.” It reflects the market’s expectation of future volatility by analyzing option prices on the S&P 500. While designed for equities, its concepts have become a benchmark across financial markets.
For crypto traders, understanding how the VIX works, and how similar approaches can be applied to Bitcoin and other digital assets, provides a powerful framework for reading sentiment, spotting risk, and planning strategies in unpredictable conditions.
What Is the Volatility Index (VIX)?
The Volatility Index, commonly known as the VIX, is a daily market indicator created by the CBOE. It measures the market’s expectation of volatility over the next 30 days, based on option prices of the S&P 500. Unlike historical volatility, which looks backward, the VIX is forward-looking, capturing implied volatility derived from options.
Often called the “fear index,” the VIX rises when investors expect turbulence. Sharp declines in equities typically push investors to buy protective options, raising option premiums and driving the index higher. Conversely, calm market conditions lower demand for hedging, pushing VIX readings down.
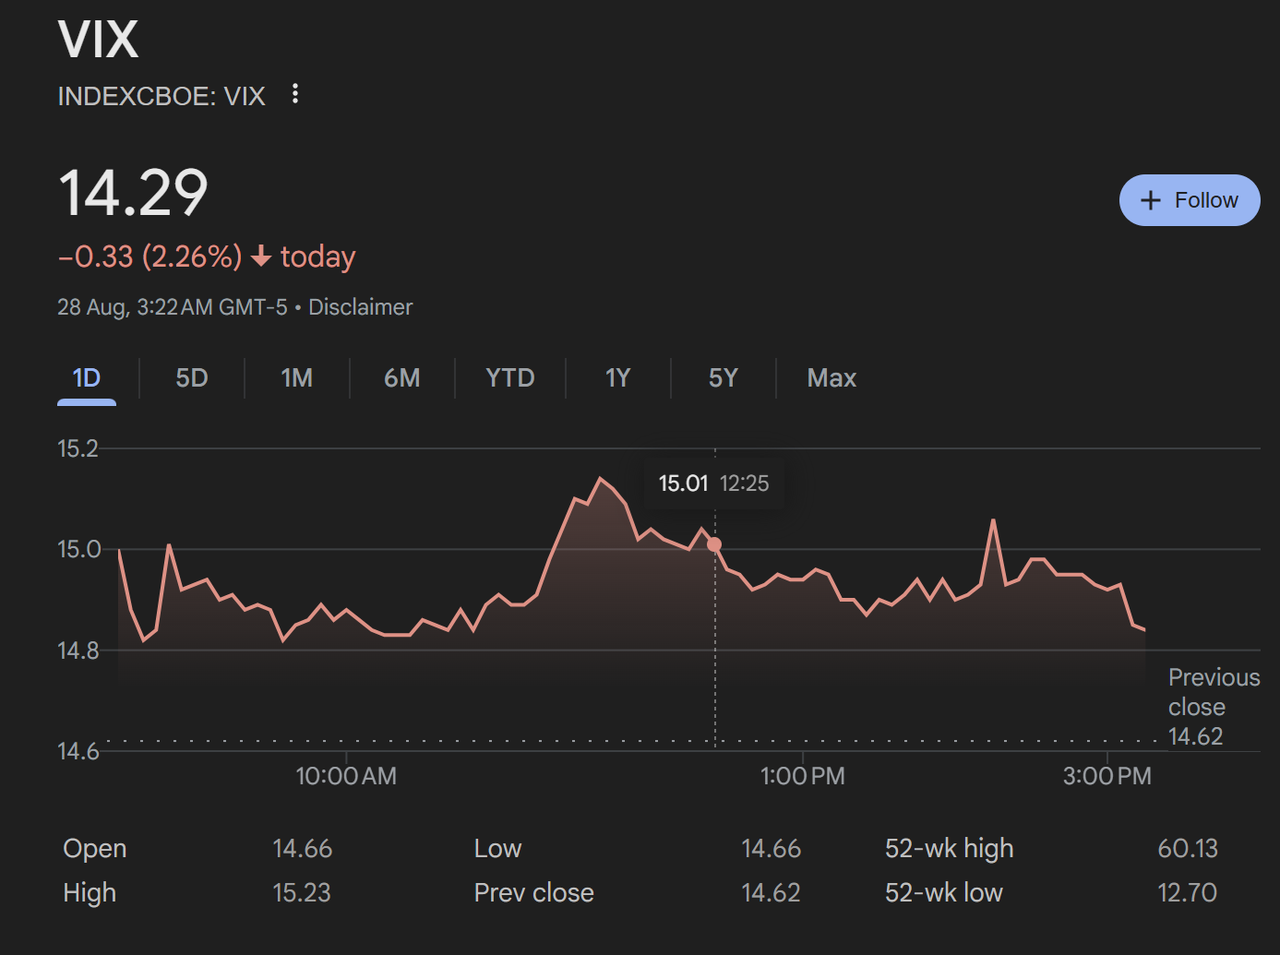
Chicago Board Options Exchange's CBOE Volatility Index (VIX) | Source: Google
It’s important to distinguish between realized volatility, which reflects past price behavior, and implied volatility, which reflects market expectations. This forward-looking nature makes the VIX one of the most closely watched indicators of investor sentiment worldwide.
How VIX Works in Traditional Finance
In equity markets, the VIX is calculated from option prices on the S&P 500. Options carry strike prices and expiration dates, and their premiums reflect expectations of future swings. By aggregating this data, the VIX produces an annualized implied volatility figure, a snapshot of expected risk.
When investor fear rises, demand for options surges, lifting the VIX. During calmer periods, the index falls. This makes it a leading indicator of market sentiment. Portfolio managers use it for hedging, diversification, and anticipating turbulence before it’s fully reflected in stock prices.
Crypto Markets and Volatility: The Parallel
Unlike equities, cryptocurrencies lack an official benchmark like the VIX. This absence stems from crypto’s fragmented markets and its relatively short trading history. Yet, measuring expected volatility remains vital for traders.
Bitcoin and Ethereum are far more volatile than equities. While the S&P 500 might move 1–2% daily, Bitcoin can swing 5–10% in hours. This heightened volatility creates both rapid opportunities and severe risks.
To bridge the gap, traders rely on implied volatility from crypto options markets. Platforms like Deribit and CME publish data that mirrors the VIX methodology, offering a forward-looking “crypto fear gauge.” These measures help traders anticipate price turbulence.
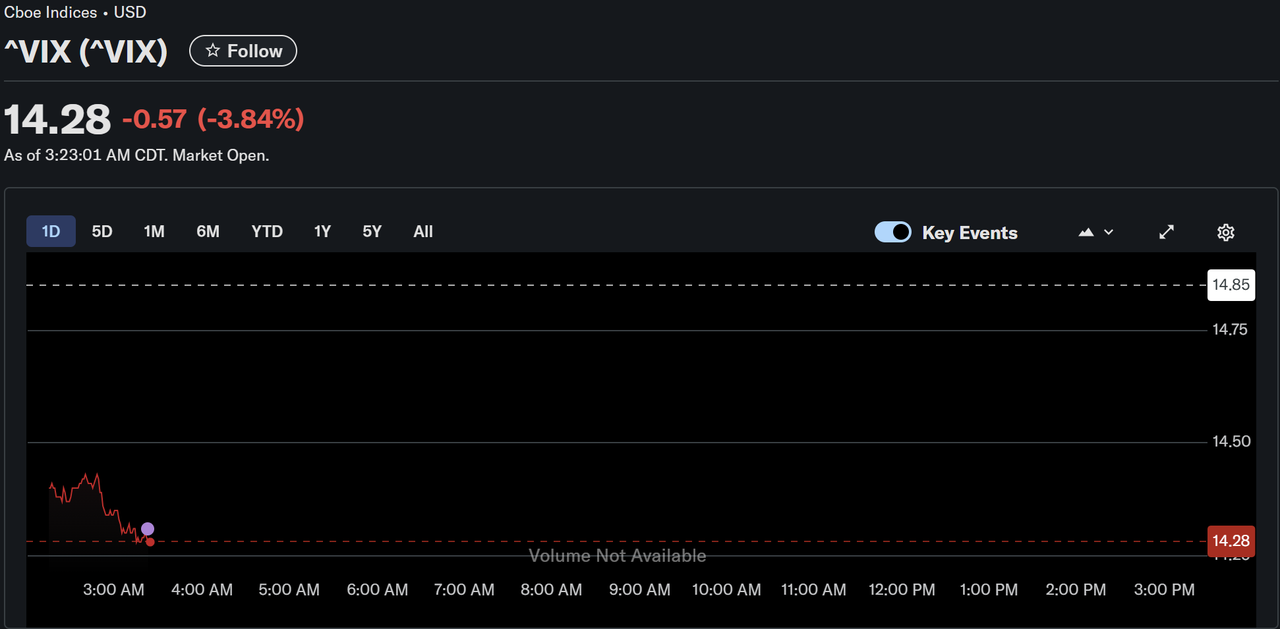
Chicago Board Options Exchange's CBOE Volatility Index (VIX) | Source: Yahoo
Bitcoin is also seen as a hedge against global uncertainty. During equity sell-offs or geopolitical shocks, capital sometimes shifts toward Bitcoin as a safe haven, just as it flows into gold.
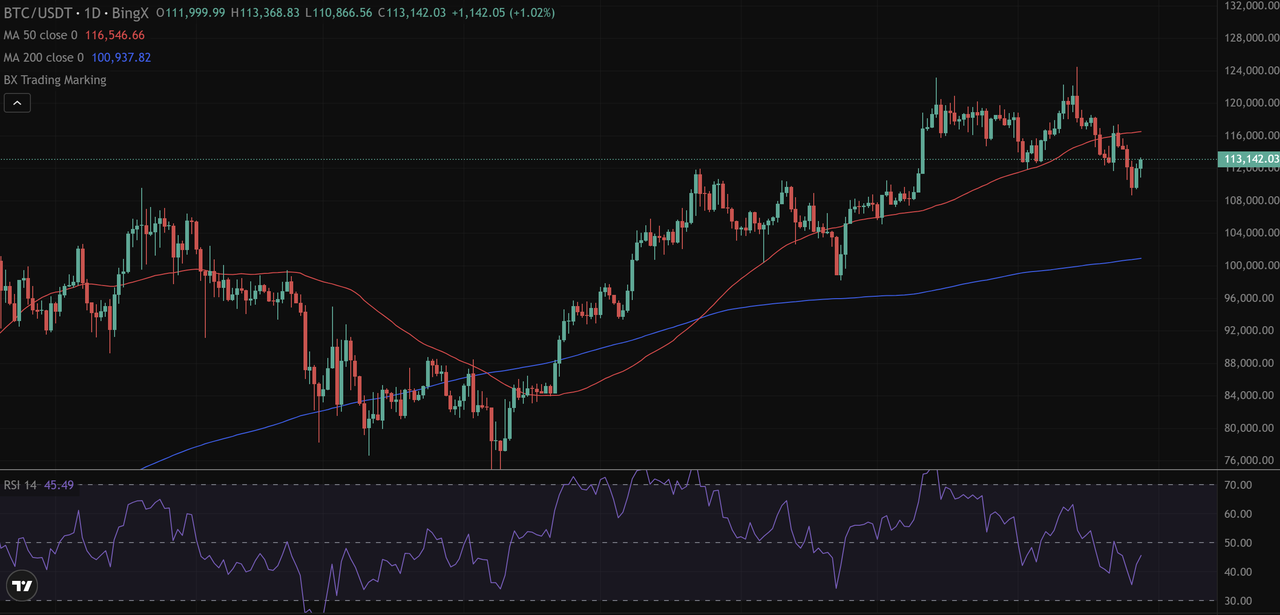
Bitcoin (BTC/USD) Daily Price Chart | Source: BingX
For example, on August 28 the VIX closed at 14.29, well below its 52-week high of 60.13. A reading this low signals stability in equities. At the same time, Bitcoin traded near $113,142 on BingX, showing weakness despite calm stock markets. This illustrates how crypto can diverge but still reacts when VIX spikes sharply.
In essence, while the VIX is built for equities, its logic provides a framework for understanding risk in the far more volatile world of crypto.
How to Measure Crypto Volatility: Alternatives to VIX
Since crypto lacks a formal VIX, traders rely on both realized and implied volatility. Realized volatility measures actual swings over a given period, such as 30 or 90 days. Implied volatility comes from options pricing, reflecting expectations of future turbulence.
Efforts to build crypto-specific benchmarks include the Bitcoin Volatility Index (BVIN), modeled after the CBOE VIX but based on Bitcoin options data. Ethereum-focused versions are also emerging as its derivatives market expands. Exchanges like Deribit and CME publish implied volatility data that traders already treat as a proxy for a “crypto VIX.”
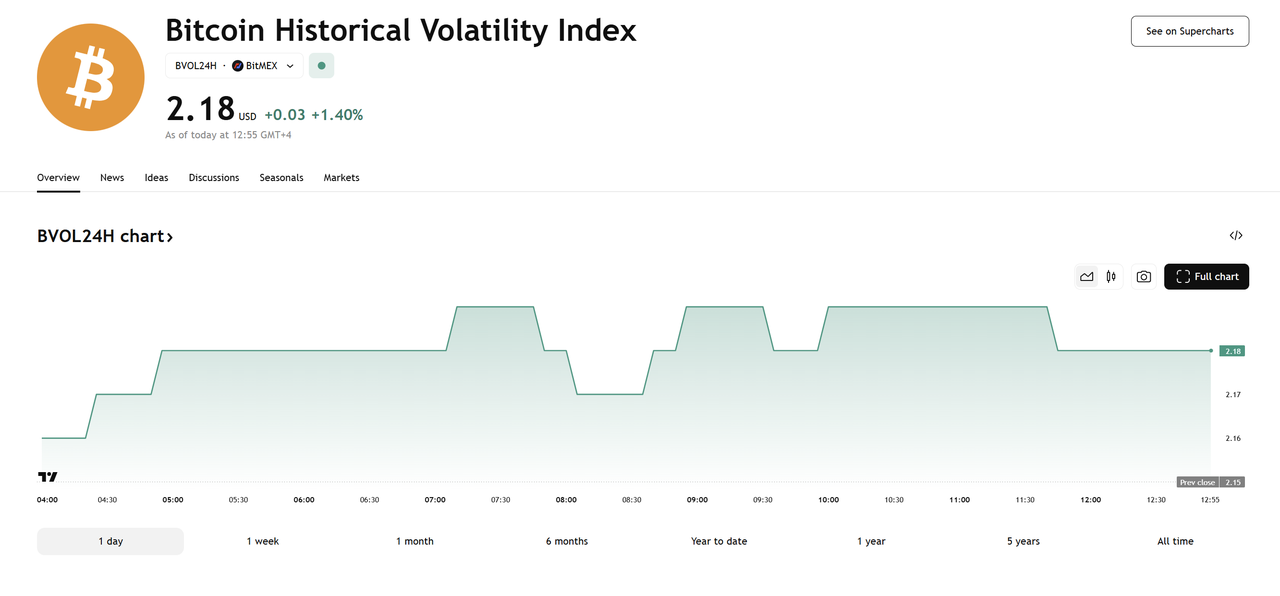
Bitcoin Historical Volatility Index | Source: Tradingview
On the realized side, TradingView publishes the Bitcoin Historical Volatility Index (BVOL24H), which recently stood at 2.18, slightly above its prior close. Unlike the VIX, BVOL is backward-looking, but when combined with implied volatility it gives traders a fuller picture: what the market expects versus what actually happened.
When BVOL readings rise, it signals heightened turbulence. When they fall, it often precedes a major breakout, making these indexes as critical as price charts for seasoned traders.
Why VIX Concepts Matter for Crypto Traders
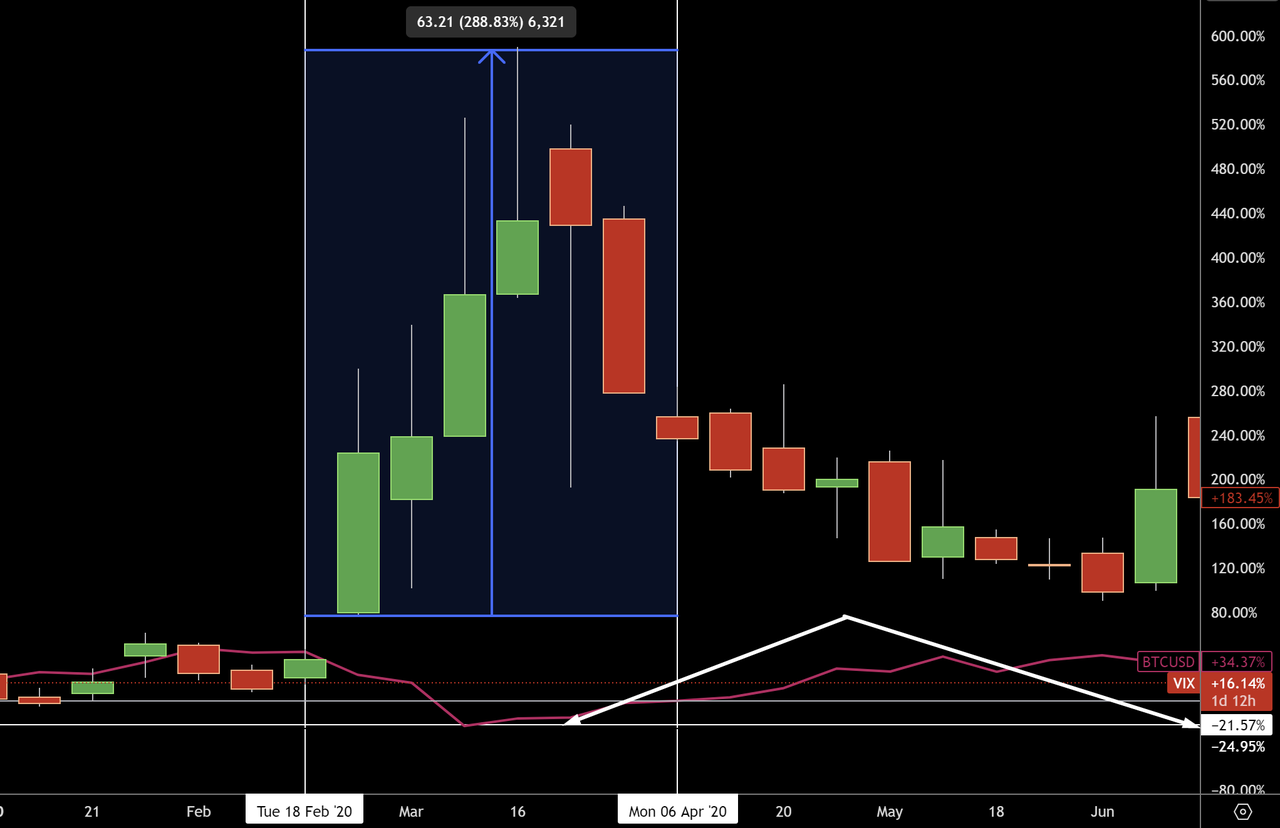
Volatility indexes are not just academic but also directly shape trading strategies. Historically, when the CBOE VIX spikes above 30, global markets brace for turbulence. During the COVID crash in March 2020, the VIX surged over +63 points (+288%), its steepest rise since 2008.
Bitcoin mirrored this stress, plunging more than 40% in a week, before rebounding nearly 290% by April as volatility cooled. This underscored how equity fear can spill into crypto.
Even without a formal “crypto VIX,” implied volatility in Bitcoin options provides similar insights. On Deribit, implied volatility has reached 90–100% annualized during selloffs, compared with the S&P 500’s long-term average of 20%.
For traders, these measures translate into actionable signals:
• Entry & Exit Timing: In late 2023, Bitcoin’s 30-day realized volatility dipped below 20%, just before BTC rallied 40% in three months.
• Downside Protection: Rising implied volatility often foreshadows corrections, prompting hedges with puts or stablecoin rotation.
• Safe Haven Flows: In March 2023 banking turmoil, Bitcoin gained 25% in two weeks while the VIX stayed elevated above 25.
• Diversification: By tracking both VIX and crypto volatility indexes, investors balance portfolios across equities, commodities, and crypto.
In short, VIX concepts give traders a roadmap to anticipate turbulence, protect capital, and seize opportunity in volatile markets.
What Are the Limitations of Volatility Index (VIX)?
Despite its value, the VIX has limitations when applied to crypto. It is based on S&P 500 options, not digital assets, so signals don’t always align with Bitcoin or Ethereum. Crypto also trades 24/7, while equities do not, leaving gaps where volatility surges outside VIX readings.
Crypto-specific indexes like BVOL or BVIN are promising but lack long-term adoption and historical depth. Overreliance on any single metric can be misleading, which is why traders must combine VIX-style insights with technical indicators, on-chain analysis, and market structure signals.
Conclusion
Volatility is the heartbeat of crypto markets, and while there is no official “Crypto VIX,” applying VIX concepts offers traders an edge. By combining realized and implied volatility measures from platforms like Deribit, CME, and TradingView with traditional VIX signals, traders can better assess sentiment, anticipate swings, and manage risk.
The takeaway is clear: volatility is not noise, it’s information. For crypto investors, reading it correctly can mean the difference between being blindsided by turbulence and positioning early for opportunity. In markets where price swings are the norm, the fear gauge remains an invaluable guide.
Related Articles
FAQs of Volatility Index (VIX) in Crypto Trading
1. What is the Volatility Index (VIX)?
The VIX is a market index created by the Chicago Board Options Exchange (CBOE) that measures expected volatility in the S&P 500 based on options prices. It’s often called the “fear index” because it rises when investor uncertainty increases.
2. Does crypto have its own VIX?
Not officially. However, alternatives like the Bitcoin Volatility Index (BVIN) and BVOL24H on TradingView track Bitcoin’s realized or implied volatility. These work as crypto-specific fear gauges.
3. Why should crypto traders watch the VIX?
While designed for equities, the VIX influences global risk sentiment. Sharp VIX spikes often coincide with turbulence in Bitcoin and Ethereum, making it a useful signal for crypto traders.
4. How is crypto volatility measured?
Crypto volatility is measured using both realized volatility (actual past swings) and implied volatility (future expectations from options). Deribit and CME provide implied volatility data for Bitcoin and Ethereum.
5. How can traders use volatility indexes in crypto?
Volatility indexes help traders plan entries, exits, and hedging strategies. Rising implied volatility can warn of downside risk, while low volatility often precedes breakouts. Traders may hedge with Bitcoin options, futures, or stablecoins.